Pottery Barn 2005 Annual Report Download - page 55
Download and view the complete annual report
Please find page 55 of the 2005 Pottery Barn annual report below. You can navigate through the pages in the report by either clicking on the pages listed below, or by using the keyword search tool below to find specific information within the annual report.-
 1
1 -
2
-
3
-
4
-
5
-
6
-
7
-
8
-
9
-
10
-
11
-
12
-
13
-
14
-
15
-
16
-
17
-
18
-
19
-
20
-
21
-
22
-
23
-
24
-
25
-
26
-
27
-
28
-
29
-
30
-
31
-
32
-
33
-
34
-
35
-
36
-
37
-
38
-
39
-
40
-
41
-
42
-
43
-
44
-
 45
45 -
 46
46 -
 47
47 -
 48
48 -
 49
49 -
 50
50 -
 51
51 -
 52
52 -
 53
53 -
 54
54 -
 55
55 -
 56
56 -
 57
57 -
 58
58 -
 59
59 -
 60
60 -
 61
61 -
 62
62 -
 63
63 -
 64
64 -
 65
65 -
66
-
67
-
68
-
69
-
70
-
71
-
72
-
73
-
74
-
75
-
76
-
77
-
78
-
79
-
80
-
81
-
82
-
83
-
84
-
85
-
86
-
87
-
88
-
89
-
90
-
91
-
92
-
93
-
94
-
95
-
96
-
97
-
98
-
99
-
100
-
101
-
102
-
103
-
104
-
105
-
106
-
107
-
108
-
109
-
110
-
111
-
112
-
113
-
114
-
115
-
116
-
117
-
118
-
119
-
120
-
121
-
122
-
123
-
124
-
125
-
126
-
127
-
128
-
129
-
130
-
131
-
132
-
133
-
134
-
135
-
136
-
137
-
138
-
139
-
140
-
141
-
142
-
143
-
144
-
145
-
146
-
147
-
148
-
149
-
150
-
151
-
152
-
153
-
154
-
155
-
156
-
157
-
158
-
159
-
160
 |
 |

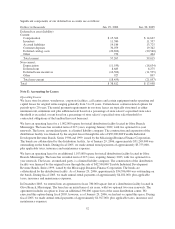
Merchandise Inventories
Merchandise inventories, net of an allowance for excess quantities and obsolescence, are stated at the lower of
cost (weighted average method) or market. We estimate a provision for damaged, obsolete, excess and slow-
moving inventory based on inventory aging reports and specific identification. We generally reserve, based on
inventory aging reports, for 50% of the cost of all inventory between one and two years old and 100% of the cost
of all inventory over two years old. If actual obsolescence is different from our estimate, we will adjust our
provision accordingly. Specific reserves are also recorded in the event the cost of the inventory exceeds the fair
market value. In addition, on a monthly basis, we estimate a reserve for expected shrinkage at the concept and
channel level based on historical shrinkage factors and our current inventory levels. Actual shrinkage is recorded
at year-end based on the results of our physical inventory count and can vary from our estimates due to such
factors as changes in operations within our distribution centers, the mix of our inventory (which ranges from
large furniture to small tabletop items) and execution against loss prevention initiatives in our stores, off-site
storage locations, and our third party transportation providers.
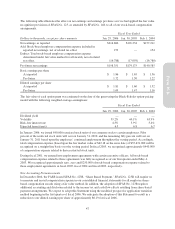
Approximately 63%, 62% and 61% of our merchandise purchases in fiscal 2005, fiscal 2004 and fiscal 2003,
respectively, were foreign-sourced, primarily from Asia and Europe.
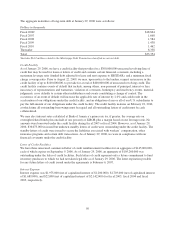
Prepaid Catalog Expenses
Prepaid catalog expenses consist of third party incremental direct costs, including creative design, paper,
printing, postage and mailing costs for all of our direct response catalogs. Such costs are capitalized as prepaid
catalog expenses and are amortized over their expected period of future benefit. Such amortization is based upon
the ratio of actual revenues to the total of actual and estimated future revenues on an individual catalog basis.
Estimated future revenues are based upon various factors such as the total number of catalogs and pages
circulated, the probability and magnitude of consumer response and the assortment of merchandise offered. Each
catalog is generally fully amortized over a six to nine month period, with the majority of the amortization
occurring within the first four to five months. Prepaid catalog expenses are evaluated for realizability on a
monthly basis by comparing the carrying amount associated with each catalog to the estimated probable
remaining future profitability (remaining net revenues less merchandise cost of goods sold, selling expenses and
catalog related-costs) associated with that catalog. If the catalog is not expected to be profitable, the carrying
amount of the catalog is impaired accordingly. Catalog advertising expenses were $321,610,000, $278,169,000
and $250,337,000 in fiscal 2005, fiscal 2004 and fiscal 2003, respectively.
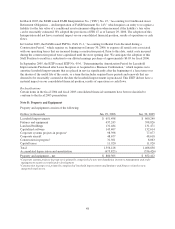
Property and Equipment
Property and equipment is stated at cost. Depreciation is computed using the straight-line method over the
estimated useful lives of the assets below. Any reduction in the estimated lives would result in higher
depreciation expense in a given period for the related assets.
Leasehold improvements
Shorter of estimated useful life or lease term
(generally 3 – 22 years)
Fixtures and equipment 2 – 20 years
Buildings and building improvements 12 – 40 years
Capitalized software 2 – 10 years
Corporate aircraft 20 years (20% salvage value)
Capital leases
Shorter of estimated useful life or lease term
(generally 4 – 5 years)
Internally developed software costs are capitalized in accordance with the American Institute of Certified Public
Accountants Statement of Position 98-1, “Accounting for the Costs of Computer Software Developed or
Obtained for Internal Use.”
Interest costs related to assets under construction, including software projects, are capitalized during the
construction or development period. We capitalized interest costs of $1,200,000, $1,689,000 and $2,142,000 in
fiscal 2005, fiscal 2004 and fiscal 2003, respectively.
43
Form 10-K