Pottery Barn 2005 Annual Report Download - page 50
Download and view the complete annual report
Please find page 50 of the 2005 Pottery Barn annual report below. You can navigate through the pages in the report by either clicking on the pages listed below, or by using the keyword search tool below to find specific information within the annual report.-
 1
1 -
2
-
3
-
4
-
5
-
6
-
7
-
8
-
9
-
10
-
11
-
12
-
13
-
14
-
15
-
16
-
17
-
18
-
19
-
20
-
21
-
22
-
23
-
24
-
25
-
26
-
27
-
28
-
29
-
30
-
31
-
32
-
33
-
34
-
35
-
36
-
37
-
38
-
39
-
 40
40 -
 41
41 -
 42
42 -
 43
43 -
 44
44 -
 45
45 -
 46
46 -
 47
47 -
 48
48 -
 49
49 -
 50
50 -
 51
51 -
 52
52 -
 53
53 -
 54
54 -
 55
55 -
 56
56 -
 57
57 -
 58
58 -
 59
59 -
 60
60 -
61
-
62
-
63
-
64
-
65
-
66
-
67
-
68
-
69
-
70
-
71
-
72
-
73
-
74
-
75
-
76
-
77
-
78
-
79
-
80
-
81
-
82
-
83
-
84
-
85
-
86
-
87
-
88
-
89
-
90
-
91
-
92
-
93
-
94
-
95
-
96
-
97
-
98
-
99
-
100
-
101
-
102
-
103
-
104
-
105
-
106
-
107
-
108
-
109
-
110
-
111
-
112
-
113
-
114
-
115
-
116
-
117
-
118
-
119
-
120
-
121
-
122
-
123
-
124
-
125
-
126
-
127
-
128
-
129
-
130
-
131
-
132
-
133
-
134
-
135
-
136
-
137
-
138
-
139
-
140
-
141
-
142
-
143
-
144
-
145
-
146
-
147
-
148
-
149
-
150
-
151
-
152
-
153
-
154
-
155
-
156
-
157
-
158
-
159
-
160
 |
 |

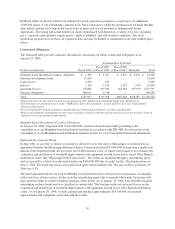
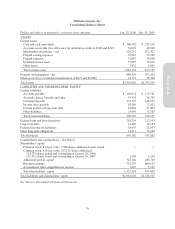
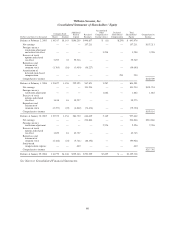
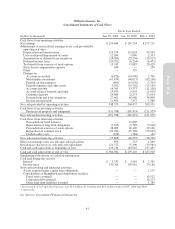
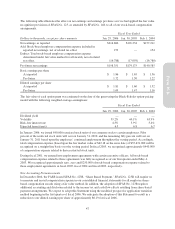
ITEM 8. FINANCIAL STATEMENTS AND SUPPLEMENTARY DATA
Williams-Sonoma, Inc.
Consolidated Statements of Earnings
Fiscal Year Ended
Dollars and shares in thousands, except per share amounts Jan. 29, 2006 Jan. 30, 2005 Feb. 1, 2004
Net revenues $3,538,947 $3,136,931 $2,754,368
Cost of goods sold 2,103,465 1,865,786 1,643,791
Gross margin 1,435,482 1,271,145 1,110,577
Selling, general and administrative expenses 1,090,392 961,176 855,790
Interest income (5,683) (1,939) (873)
Interest expense 1,975 1,703 22
Earnings before income taxes 348,798 310,205 255,638
Income taxes 133,932 118,971 98,427
Net earnings $ 214,866 $ 191,234 $ 157,211
Basic earnings per share $ 1.86 $ 1.65 $ 1.36
Diluted earnings per share $ 1.81 $ 1.60 $ 1.32
Shares used in calculation of earnings per share:
Basic 115,616 116,159 115,583
Diluted 118,427 119,347 119,016
See Notes to Consolidated Financial Statements.
38