Pottery Barn 2005 Annual Report Download - page 38
Download and view the complete annual report
Please find page 38 of the 2005 Pottery Barn annual report below. You can navigate through the pages in the report by either clicking on the pages listed below, or by using the keyword search tool below to find specific information within the annual report.-
 1
1 -
2
-
3
-
4
-
5
-
6
-
7
-
8
-
9
-
10
-
11
-
12
-
13
-
14
-
15
-
16
-
17
-
18
-
19
-
20
-
21
-
22
-
23
-
24
-
25
-
26
-
27
-
 28
28 -
 29
29 -
 30
30 -
 31
31 -
 32
32 -
 33
33 -
 34
34 -
 35
35 -
 36
36 -
 37
37 -
 38
38 -
 39
39 -
 40
40 -
 41
41 -
 42
42 -
 43
43 -
 44
44 -
 45
45 -
 46
46 -
 47
47 -
 48
48 -
49
-
50
-
51
-
52
-
53
-
54
-
55
-
56
-
57
-
58
-
59
-
60
-
61
-
62
-
63
-
64
-
65
-
66
-
67
-
68
-
69
-
70
-
71
-
72
-
73
-
74
-
75
-
76
-
77
-
78
-
79
-
80
-
81
-
82
-
83
-
84
-
85
-
86
-
87
-
88
-
89
-
90
-
91
-
92
-
93
-
94
-
95
-
96
-
97
-
98
-
99
-
100
-
101
-
102
-
103
-
104
-
105
-
106
-
107
-
108
-
109
-
110
-
111
-
112
-
113
-
114
-
115
-
116
-
117
-
118
-
119
-
120
-
121
-
122
-
123
-
124
-
125
-
126
-
127
-
128
-
129
-
130
-
131
-
132
-
133
-
134
-
135
-
136
-
137
-
138
-
139
-
140
-
141
-
142
-
143
-
144
-
145
-
146
-
147
-
148
-
149
-
150
-
151
-
152
-
153
-
154
-
155
-
156
-
157
-
158
-
159
-
160
 |
 |
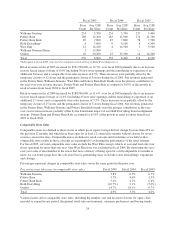
Within our reportable segments, the direct-to-customer channel does not incur freight-to-store or store occupancy
expenses, and typically operates with lower markdowns and inventory shrinkage than the retail channel.
However, the direct-to-customer channel incurs higher shipping, damage and replacement costs than the retail
channel.
Fiscal 2005 vs. Fiscal 2004
Cost of goods sold increased by $237,679,000, or 12.7%, in fiscal 2005 over fiscal 2004. Including an
approximate $4,500,000 charge associated with transitioning the merchandising strategies of our Hold
Everything brand into our other existing brands, cost of goods sold as a percentage of net revenues decreased 10
basis points in fiscal 2005 from fiscal 2004, primarily driven by rate reductions in shipping and occupancy costs,
partially offset by a rate increase in cost of goods. The rate reduction in shipping costs was primarily due to the
successful refining of our furniture delivery network, including the late 2004 in-sourcing of our line-haul
management and cost efficiencies gained from our east coast distribution center, partially offset by a year-over-
year increase in fuel surcharges. The rate reduction in occupancy expenses was primarily due to sales leverage in
the retail channel, partially offset by increased distribution leased square footage in the direct-to-customer
channel and lease termination costs associated with transitioning the merchandising strategies of our Hold
Everything brand into our other existing brands. The rate increase in cost of goods was primarily due to the costs
associated with the implementation of the daily store replenishment program in April and May of 2005 and a
higher percentage of total company net revenues being driven by furniture, which generates a lower than average
gross margin rate, as well as the write-down of impaired merchandise inventories associated with transitioning
the merchandising strategies of our Hold Everything brand into our other existing brands.
In the retail channel, cost of goods sold as a percentage of retail net revenues decreased 20 basis points during
fiscal 2005 compared to fiscal 2004. This was primarily due to sales leverage in fixed occupancy expenses,
despite the lease termination costs associated with the merchandising transition in the Hold Everything brand into
our other existing brands. Although cost of goods as a percentage of retail net revenues remained relatively flat
compared to fiscal 2004, we saw a rate decrease in cost of merchandise driven by increased full-price selling in
the Pottery Barn and Williams-Sonoma brands, partially offset by the write-down of impaired merchandise
inventories associated with transitioning the merchandising strategies of our Hold Everything brand into our
other existing brands and increased costs associated with the 2005 daily store replenishment program.
In the direct-to-customer channel, cost of goods sold as a percentage of direct-to-customer net revenues remained
relatively flat in fiscal 2005 compared to fiscal 2004. This was primarily due to rate increases in cost of goods
and occupancy expenses, offset by a rate reduction in shipping costs. The rate increase in cost of goods was
primarily due to a furniture-driven rate increase, as well as the write-down of impaired merchandise inventories
associated with transitioning the merchandising strategies of our Hold Everything brand into our other existing
brands. The rate increase in occupancy expenses was primarily a function of higher distribution occupancy
expenses resulting from increased distribution leased square footage versus fiscal 2004. The rate reduction in
shipping costs was primarily due to the successful refining of our furniture delivery network, including the late
2004 in-sourcing of our line-haul management and cost efficiencies gained from our east coast distribution
center, partially offset by a year-over-year increase in fuel surcharges.
Fiscal 2004 vs. Fiscal 2003
Cost of goods sold increased by $221,995,000, or 13.5%, in fiscal 2004 over fiscal 2003. As a percentage of net
revenues, cost of goods sold decreased 20 basis points in fiscal 2004 from fiscal 2003, primarily driven by a rate
reduction in occupancy expenses and shipping costs, partially offset by an increase in cost of goods. The rate
reduction in occupancy expenses was primarily due to a greater percentage of total company net revenues being
generated in the direct-to-customer channel, which does not incur store occupancy expenses. The rate
improvement in shipping costs was primarily due to a full-year benefit of expense reductions in 2004 associated
with the mid-2003 consolidation of freight providers, the in-sourcing of our line-haul management in the
furniture delivery network, and reductions in furniture delivery costs driven by efficiencies gained from the new
east coast distribution center. This rate improvement was partially offset by additional cost earlier in the year as
we overcame initial challenges of balancing inventory allocations between the coastal distribution centers and a
26