Pottery Barn 2005 Annual Report Download - page 39
Download and view the complete annual report
Please find page 39 of the 2005 Pottery Barn annual report below. You can navigate through the pages in the report by either clicking on the pages listed below, or by using the keyword search tool below to find specific information within the annual report.-
 1
1 -
2
-
3
-
4
-
5
-
6
-
7
-
8
-
9
-
10
-
11
-
12
-
13
-
14
-
15
-
16
-
17
-
18
-
19
-
20
-
21
-
22
-
23
-
24
-
25
-
26
-
27
-
28
-
 29
29 -
 30
30 -
 31
31 -
 32
32 -
 33
33 -
 34
34 -
 35
35 -
 36
36 -
 37
37 -
 38
38 -
 39
39 -
 40
40 -
 41
41 -
 42
42 -
 43
43 -
 44
44 -
 45
45 -
 46
46 -
 47
47 -
 48
48 -
 49
49 -
50
-
51
-
52
-
53
-
54
-
55
-
56
-
57
-
58
-
59
-
60
-
61
-
62
-
63
-
64
-
65
-
66
-
67
-
68
-
69
-
70
-
71
-
72
-
73
-
74
-
75
-
76
-
77
-
78
-
79
-
80
-
81
-
82
-
83
-
84
-
85
-
86
-
87
-
88
-
89
-
90
-
91
-
92
-
93
-
94
-
95
-
96
-
97
-
98
-
99
-
100
-
101
-
102
-
103
-
104
-
105
-
106
-
107
-
108
-
109
-
110
-
111
-
112
-
113
-
114
-
115
-
116
-
117
-
118
-
119
-
120
-
121
-
122
-
123
-
124
-
125
-
126
-
127
-
128
-
129
-
130
-
131
-
132
-
133
-
134
-
135
-
136
-
137
-
138
-
139
-
140
-
141
-
142
-
143
-
144
-
145
-
146
-
147
-
148
-
149
-
150
-
151
-
152
-
153
-
154
-
155
-
156
-
157
-
158
-
159
-
160
 |
 |

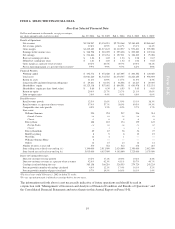
need to ship merchandise out of market to our customers in order to fill backorders. The rate increase in cost of
goods was primarily due to a higher percentage of total company net revenues being driven by furniture, which
generates a lower than average gross margin rate, in addition to higher returns, replacements and damages.
In the retail channel, cost of goods sold as a percentage of retail net revenues remained relatively flat in fiscal
2004 compared to fiscal 2003. This was primarily driven by a year-over-year rate decrease in merchandise cost
of goods, offset by an increase in our store occupancy expense rate.
In the direct-to-customer channel, cost of goods sold as a percentage of direct-to-customer net revenues increased
10 basis points during fiscal 2004 compared to fiscal 2003. This rate increase was primarily the result of a higher
cost of merchandise due to a higher percentage of net revenues being driven by furniture, which generates a
lower than average gross margin, in addition to higher replacements and damages. This was partially offset by an
improvement in shipping costs in fiscal 2004 and a rate reduction in occupancy expenses. The improvement in
shipping costs was due to the full-year benefit of expense reductions in 2004 associated with the mid-2003
consolidation of freight providers, the in-sourcing of our line-haul management in the furniture delivery network,
and reductions in furniture delivery costs driven by efficiencies gained from the new east coast distribution
center. The rate reduction in occupancy expenses was primarily due to the continued leveraging of sales.
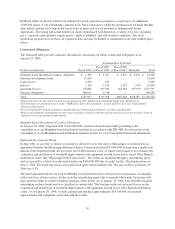
SELLING, GENERAL AND ADMINISTRATIVE EXPENSES
Selling, general and administrative expenses consist of non-occupancy related costs associated with our retail
stores, distribution warehouses, customer care centers, supply chain operations (buying, receiving and
inspection), and corporate administrative functions. These costs include employment, advertising, third party
credit card processing, and other general expenses.
Due to their distinct distribution and marketing strategies, we experience differing employment and advertising
costs as a percentage of net revenues within the retail and direct-to-customer segments. Store employment costs
represent a greater percentage of retail net revenues than employment costs as a percentage of net revenues
within the direct-to-customer segment. However, catalog advertising expenses are greater within the
direct-to-customer channel than the retail channel.
Fiscal 2005 vs. Fiscal 2004
Selling, general and administrative expenses increased by $129,216,000, or 13.4%, to $1,090,392,000 in fiscal
2005 from $961,176,000 in fiscal 2004. Including an approximate $9,000,000 charge associated with
transitioning the merchandising strategies of our Hold Everything brand into our other existing brands, selling,
general and administrative expenses expressed as a percentage of net revenues increased to 30.8% in fiscal 2005
from 30.6% in fiscal 2004. This 20 basis point increase as a percentage of net revenues was primarily due to
higher catalog advertising expenses and other general expenses, partially offset by rate reductions in employee
benefit costs. Increased paper costs across all brands drove the majority of the catalog advertising expense
increase. The increase in other general expenses was primarily due to asset impairment costs associated with the
early shutdown of our Hold Everything stores as a result of transitioning the merchandising strategies of our
Hold Everything brand into our other existing brands.
In the retail channel, selling, general and administrative expenses as a percentage of retail net revenues increased
approximately 50 basis points in fiscal 2005 versus fiscal 2004, primarily driven by an increase in other general
expenses due to asset impairment costs associated with the early shutdown of our Hold Everything stores as a
result of transitioning the merchandising strategies of our Hold Everything brand into our other existing brands,
in addition to higher catalog advertising expenses. Increased paper costs drove the majority of the catalog
advertising expense increase. This rate increase was partially offset by rate reductions in employee benefit costs.
In the direct-to-customer channel, selling, general and administrative expenses as a percentage of
direct-to-customer net revenues increased by approximately 40 basis points in fiscal 2005 compared to fiscal
2004. This rate increase was primarily driven by higher catalog advertising expenses resulting from increased
paper costs across all brands, and an increase in other general expenses, including asset impairment costs as a
result of transitioning the merchandising strategies of our Hold Everything brand into our other existing brands.
27
Form 10-K