Pottery Barn 2005 Annual Report Download - page 40
Download and view the complete annual report
Please find page 40 of the 2005 Pottery Barn annual report below. You can navigate through the pages in the report by either clicking on the pages listed below, or by using the keyword search tool below to find specific information within the annual report.-
 1
1 -
2
-
3
-
4
-
5
-
6
-
7
-
8
-
9
-
10
-
11
-
12
-
13
-
14
-
15
-
16
-
17
-
18
-
19
-
20
-
21
-
22
-
23
-
24
-
25
-
26
-
27
-
28
-
29
-
 30
30 -
 31
31 -
 32
32 -
 33
33 -
 34
34 -
 35
35 -
 36
36 -
 37
37 -
 38
38 -
 39
39 -
 40
40 -
 41
41 -
 42
42 -
 43
43 -
 44
44 -
 45
45 -
 46
46 -
 47
47 -
 48
48 -
 49
49 -
 50
50 -
51
-
52
-
53
-
54
-
55
-
56
-
57
-
58
-
59
-
60
-
61
-
62
-
63
-
64
-
65
-
66
-
67
-
68
-
69
-
70
-
71
-
72
-
73
-
74
-
75
-
76
-
77
-
78
-
79
-
80
-
81
-
82
-
83
-
84
-
85
-
86
-
87
-
88
-
89
-
90
-
91
-
92
-
93
-
94
-
95
-
96
-
97
-
98
-
99
-
100
-
101
-
102
-
103
-
104
-
105
-
106
-
107
-
108
-
109
-
110
-
111
-
112
-
113
-
114
-
115
-
116
-
117
-
118
-
119
-
120
-
121
-
122
-
123
-
124
-
125
-
126
-
127
-
128
-
129
-
130
-
131
-
132
-
133
-
134
-
135
-
136
-
137
-
138
-
139
-
140
-
141
-
142
-
143
-
144
-
145
-
146
-
147
-
148
-
149
-
150
-
151
-
152
-
153
-
154
-
155
-
156
-
157
-
158
-
159
-
160
 |
 |
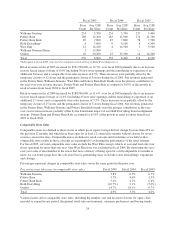
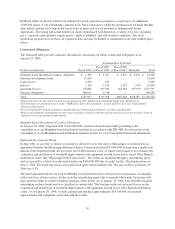
Fiscal 2004 vs. Fiscal 2003
Selling, general and administrative expenses increased by $105,386,000, or 12.3%, to $961,176,000 in fiscal
2004 from $855,790,000 in fiscal 2003. Selling, general and administrative expenses expressed as a percentage
of net revenues decreased to 30.6% in fiscal 2004 from 31.1% in fiscal 2003. This 50 basis point improvement as
a percentage of net revenues was primarily due to a rate reduction in year-over-year employment expenses.
Contributing to the employment rate decrease were year-over-year reductions in workers’ compensation and
other employment-related costs.
In the retail channel, selling, general and administrative expenses as a percentage of retail net revenues increased
approximately 30 basis points in fiscal 2004 versus fiscal 2003, primarily driven by increases in employment and
advertising costs. The increase in the employment rate was due in part to the up front investment required in the
emerging brands prior to the opening of our new store locations.
In the direct-to-customer channel, selling, general and administrative expenses as a percentage of
direct-to-customer net revenues decreased by approximately 90 basis points in fiscal 2004 compared to fiscal
2003. This improvement was primarily driven by a rate reduction in catalog advertising and employment costs.
The rate reduction in catalog advertising costs was driven by lower catalog circulation in the emerging brands
coupled with continued sales generation by our e-commerce sites. This decrease was partially offset by growth in
the rate of other general expenses primarily due to third party outsourcing of distribution services.
INTEREST INCOME AND EXPENSE
Interest income was $5,683,000 in fiscal 2005, $1,939,000 in fiscal 2004, and $873,000 in fiscal 2003, comprised
primarily of income from short-term investments classified as cash and cash equivalents. The increase in interest
income during fiscal 2005 resulted from an increase in the interest rates associated with these short-term
investments as well as higher cash balances during fiscal 2005 compared to fiscal 2004.
Interest expense was $1,975,000 (net of capitalized interest of $1,200,000), $1,703,000 (net of capitalized interest
of $1,689,000), and $22,000 (net of capitalized interest of $2,142,000 ) for fiscal 2005, fiscal 2004 and fiscal
2003, respectively. Interest expense increased by $272,000 to $1,975,000 in fiscal 2005, primarily due to interest
expense associated with our Mississippi industrial development bonds issued in June 2004, partially offset by
lower interest expense incurred on our senior notes as a result of the repayment of our outstanding balance in
August 2005.
Interest expense increased by $1,681,000 to $1,703,000 in fiscal 2004, primarily due to additional interest
expense of $1,525,000 associated with the consolidation of our Memphis-based distribution facilities. Prior to the
adoption of Financial Accounting Standards Board (“FASB”) Interpretation No. (“FIN”) 46R, “Consolidation of
Variable Interest Entities” in fiscal 2004, this expense would have been classified as occupancy expense.
INCOME TAXES
Our effective tax rate was 38.4% for fiscal 2005 and fiscal 2004, and 38.5% for fiscal 2003. We currently expect
our fiscal 2006 effective tax rate to be in the range of 38.6% to 38.8%.
LIQUIDITY AND CAPITAL RESOURCES
As of January 29, 2006, we held $360,982,000 in cash and cash equivalent funds. As is consistent with our
industry, our cash balances are seasonal in nature, with the fourth quarter representing a significantly higher level
of cash than other periods. Throughout the fiscal year, we utilize our cash balances to build our inventory levels
in preparation for our fourth quarter holiday sales. In fiscal 2006, we plan to utilize our cash resources to fund
our inventory and inventory related purchases, catalog advertising and marketing initiatives, current store
development and infrastructure strategies, share repurchases and issuance of dividends. In addition to the current
cash balances on-hand, we have a $300,000,000 credit facility available as of January 29, 2006 that may be used
for loans or letters of credit. No amounts were borrowed by us under the credit facility in either fiscal 2005 or
fiscal 2004. However, as of January 29, 2006, $36,073,000 in issued but undrawn standby letters of credit were
28