Pottery Barn 2005 Annual Report Download - page 5
Download and view the complete annual report
Please find page 5 of the 2005 Pottery Barn annual report below. You can navigate through the pages in the report by either clicking on the pages listed below, or by using the keyword search tool below to find specific information within the annual report.-
 1
1 -
 2
2 -
 3
3 -
 4
4 -
 5
5 -
 6
6 -
 7
7 -
 8
8 -
 9
9 -
 10
10 -
 11
11 -
 12
12 -
 13
13 -
 14
14 -
 15
15 -
 16
16 -
17
-
18
-
19
-
20
-
21
-
22
-
23
-
24
-
25
-
26
-
27
-
28
-
29
-
30
-
31
-
32
-
33
-
34
-
35
-
36
-
37
-
38
-
39
-
40
-
41
-
42
-
43
-
44
-
45
-
46
-
47
-
48
-
49
-
50
-
51
-
52
-
53
-
54
-
55
-
56
-
57
-
58
-
59
-
60
-
61
-
62
-
63
-
64
-
65
-
66
-
67
-
68
-
69
-
70
-
71
-
72
-
73
-
74
-
75
-
76
-
77
-
78
-
79
-
80
-
81
-
82
-
83
-
84
-
85
-
86
-
87
-
88
-
89
-
90
-
91
-
92
-
93
-
94
-
95
-
96
-
97
-
98
-
99
-
100
-
101
-
102
-
103
-
104
-
105
-
106
-
107
-
108
-
109
-
110
-
111
-
112
-
113
-
114
-
115
-
116
-
117
-
118
-
119
-
120
-
121
-
122
-
123
-
124
-
125
-
126
-
127
-
128
-
129
-
130
-
131
-
132
-
133
-
134
-
135
-
136
-
137
-
138
-
139
-
140
-
141
-
142
-
143
-
144
-
145
-
146
-
147
-
148
-
149
-
150
-
151
-
152
-
153
-
154
-
155
-
156
-
157
-
158
-
159
-
160
 |
 |

TO OUR SHAREHOLDERS:
Fiscal 2005 was a year of strong growth, operational achievement, and financial success. We extended the
multi-channel reach of our emerging brands, reengineered our supply chain to better serve our customers, and
delivered our fifth consecutive year of record financial results. It was also a year of strategic advancements –
including the expansion and broadening of our West Elm merchandise assortment, the opening of our first three
Williams-Sonoma Home retail stores, and the decision to transition the key merchandising strategies of our Hold
Everything brand into our other existing brands by the end of 2006.
Our Fiscal 2005 Financial Results
Revenues increased 12.8% to $3.5 billion, and we delivered the highest pre-tax operating margin and diluted
earnings per share in our history, excluding a $0.07 per diluted share charge in fiscal 2005 for the transition of
the Hold Everything brand. Excluding this charge, our pre-tax operating margin increased 30 basis points to
10.2% and our diluted earnings per share increased 17.5% to $1.88. Including this charge, our pre-tax operating
margin remained flat to last year’s record level of 9.9% and our diluted earnings per share increased 13.1% to
$1.81 – a 20.6% return on shareholders’ equity. Our cash flow from operating activities increased 14% due to
strong earnings growth and effective working capital management. Our cash balance increased 51% to $361
million, and we financed all of our growth and infrastructure initiatives through internally generated funds. In
2005, $94 million, or 48% of our free cash flow, was returned to our shareholders through share repurchases.
We are extremely proud of these results and believe they are a reflection of what is unique about our company:
the strength of our brands, our superior business model – including our multi-channel strategy and lifestyle
approach to consumer marketing – and the competitive advantages we have created with our supply chain.
Our Multi-Channel Growth Drivers
The first highlight of our 2005 operating results was our growth in revenues, which increased 12.8%. This
increase was generated by impressive growth in all of our core brands and continuing momentum in our
emerging brands.
Retail revenues increased 12.3%, driven by an 8.6% increase in retail leased square footage and a comparable
store sales increase of 4.9% – the highest in five years. During 2005, we opened 18 net new stores and expanded
the leased square footage in an additional 5 stores. We ended the year with 570 stores in 43 states, the District of
Columbia, and three provinces in Canada.
Direct-to-customer revenues increased 13.6%, driven by a 4.6% increase in catalog circulation – which is a key
driver of traffic to all three of our shopping channels – and strong momentum in our e-commerce channel.
During 2005, we mailed over 385 million catalogs, significantly expanded our electronic direct marketing, and
continued to enhance the functionality of our e-commerce websites. E-commerce revenues, for the first time in
our history, exceeded catalog revenues due to the successful multi-channel impact of all of these growth
initiatives.
Growth Driven by a Portfolio of Brands
In our core brands, net revenues increased 10.9%, driven by a 10.9% increase in the Pottery Barn brand, a 13.5%
increase in the Pottery Barn Kids brand, and a 7.2% increase in the Williams-Sonoma brand.
In our emerging brands, including West Elm, Williams-Sonoma Home, PBteen, and Hold Everything, revenues
increased 35.6% – primarily driven by the strong performance of West Elm and Williams-Sonoma Home.
Excluding Hold Everything, net revenues in the emerging brands increased 48.8%. Although the emerging
brands are still in their early stages of development, we continue to be optimistic about their long-term, multi-
channel growth and profitability potential.
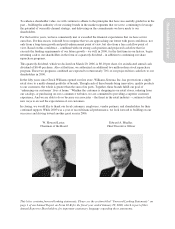
Shareholders’ Letter