Pottery Barn 2005 Annual Report Download - page 32
Download and view the complete annual report
Please find page 32 of the 2005 Pottery Barn annual report below. You can navigate through the pages in the report by either clicking on the pages listed below, or by using the keyword search tool below to find specific information within the annual report.-
 1
1 -
2
-
3
-
4
-
5
-
6
-
7
-
8
-
9
-
10
-
11
-
12
-
13
-
14
-
15
-
16
-
17
-
18
-
19
-
20
-
21
-
 22
22 -
 23
23 -
 24
24 -
 25
25 -
 26
26 -
 27
27 -
 28
28 -
 29
29 -
 30
30 -
 31
31 -
 32
32 -
 33
33 -
 34
34 -
 35
35 -
 36
36 -
 37
37 -
 38
38 -
 39
39 -
 40
40 -
 41
41 -
 42
42 -
43
-
44
-
45
-
46
-
47
-
48
-
49
-
50
-
51
-
52
-
53
-
54
-
55
-
56
-
57
-
58
-
59
-
60
-
61
-
62
-
63
-
64
-
65
-
66
-
67
-
68
-
69
-
70
-
71
-
72
-
73
-
74
-
75
-
76
-
77
-
78
-
79
-
80
-
81
-
82
-
83
-
84
-
85
-
86
-
87
-
88
-
89
-
90
-
91
-
92
-
93
-
94
-
95
-
96
-
97
-
98
-
99
-
100
-
101
-
102
-
103
-
104
-
105
-
106
-
107
-
108
-
109
-
110
-
111
-
112
-
113
-
114
-
115
-
116
-
117
-
118
-
119
-
120
-
121
-
122
-
123
-
124
-
125
-
126
-
127
-
128
-
129
-
130
-
131
-
132
-
133
-
134
-
135
-
136
-
137
-
138
-
139
-
140
-
141
-
142
-
143
-
144
-
145
-
146
-
147
-
148
-
149
-
150
-
151
-
152
-
153
-
154
-
155
-
156
-
157
-
158
-
159
-
160
 |
 |
ITEM 7. MANAGEMENT’S DISCUSSION AND ANALYSIS OF FINANCIAL CONDITION AND
RESULTS OF OPERATIONS
OVERVIEW
Fiscal 2005 Financial Results
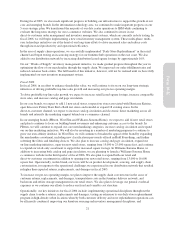
In fiscal 2005, our net revenues increased 12.8% to $3,538,947,000 from $3,136,931,000 in fiscal 2004,
primarily driven by increases in the Pottery Barn, Pottery Barn Kids, Williams-Sonoma, and West Elm concepts.
In fiscal 2005, our diluted earnings per share increased by 13.1% to $1.81 from $1.60 in fiscal 2004, including a
$13,500,000 (pre-tax), or $0.07 per diluted share, Hold Everything charge discussed below.
In our retail channel, net revenues increased 12.3% during fiscal 2005 versus fiscal 2004. This increase was
primarily driven by a year-over-year increase in retail leased square footage of 8.6%, including 18 net new stores,
and a comparable store sales increase of 4.9%. Net revenues generated in the Pottery Barn, Williams-Sonoma,
West Elm and Pottery Barn Kids brands were the primary contributors to this year-over-year net revenues
increase.
In our direct-to-customer channel, net revenues increased 13.6% during fiscal 2005 versus fiscal 2004. This year-
over-year increase was primarily driven by net revenues generated in the Pottery Barn, Pottery Barn Kids, West
Elm and Williams-Sonoma brands due to increased catalog and page circulation and continued strength in our
Internet business. Internet revenues increased 36.5% during fiscal 2005 versus fiscal 2004, primarily resulting
from our expanded efforts associated with our electronic direct marketing initiatives and strategic e-commerce
partnerships, and the incremental net revenues generated by the late 2004 launch of our Hold Everything
e-commerce website. All of our brands in the direct-to-customer channel delivered positive growth during the
fiscal year with the exception of the Hold Everything brand.
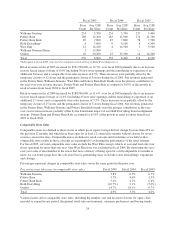
In our core brands, net revenues increased 10.9% in fiscal 2005, primarily driven by low double-digit and
low-teen net revenue increases in the Pottery Barn and Pottery Barn Kids brands, respectively, and a high single-
digit net revenue increase in the Williams-Sonoma brand.
In our emerging brands, including Hold Everything, PBteen, West Elm and Williams-Sonoma Home, net
revenues increased 35.6%, primarily driven by the strong performance of the West Elm and Williams-Sonoma
Home brands. In West Elm, the strong growth in e-commerce from the re-launch of the brand’s website to
enhance the customer’s on-line experience and the opening of eight new stores across the country (at an average
size of 17,000 square feet) drove these results. In addition, we continued to broaden the brand’s appeal by
expanding its product assortment, softening the color palate, and presenting the merchandise in a lifestyle setting
in all three channels. In Williams-Sonoma Home, the increased catalog circulation and the opening of three new
prototype stores in September and October (including an 18,000 square foot flagship store in Los Angeles) drove
these results. In addition, throughout the year, we saw a positive consumer response to our expanded
merchandise assortment, with particular strength in furniture and bedding.
In January 2006, we decided to transition the merchandising strategies of our Hold Everything brand into our
other existing brands by the end of fiscal 2006. In connection with this transition, we incurred a pre-tax charge of
approximately $13,500,000, or $0.07 per diluted share, in the fourth quarter of fiscal 2005. These costs primarily
included the initial asset impairment and lease termination costs associated with the shutdown of the Hold
Everything retail stores, the asset impairment of the e-commerce website, and the write-down of impaired
merchandise inventories. Of this pre-tax charge, approximately $4,500,000 is included in cost of goods sold and
approximately $9,000,000 is included in selling, general, and administrative expenses. We expect to incur an
additional after-tax charge of $0.03 per diluted share in the first half of fiscal 2006.
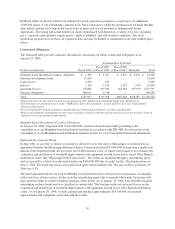
Fiscal 2005 Operational Results
Operationally, in fiscal 2005, we continued to reduce customer shipping costs, driven by the ongoing refining of
our furniture delivery network; we continued to reduce employee benefit costs as a percentage of net revenues,
driven by cost containment strategies in fringe benefits and proactive workers’ compensation initiatives; and we
continued to reduce corporate overhead expenses as a percentage of net revenues, due to strong expense
management initiatives.
20