Pottery Barn 2005 Annual Report Download - page 52
Download and view the complete annual report
Please find page 52 of the 2005 Pottery Barn annual report below. You can navigate through the pages in the report by either clicking on the pages listed below, or by using the keyword search tool below to find specific information within the annual report.-
 1
1 -
2
-
3
-
4
-
5
-
6
-
7
-
8
-
9
-
10
-
11
-
12
-
13
-
14
-
15
-
16
-
17
-
18
-
19
-
20
-
21
-
22
-
23
-
24
-
25
-
26
-
27
-
28
-
29
-
30
-
31
-
32
-
33
-
34
-
35
-
36
-
37
-
38
-
39
-
40
-
41
-
 42
42 -
 43
43 -
 44
44 -
 45
45 -
 46
46 -
 47
47 -
 48
48 -
 49
49 -
 50
50 -
 51
51 -
 52
52 -
 53
53 -
 54
54 -
 55
55 -
 56
56 -
 57
57 -
 58
58 -
 59
59 -
 60
60 -
 61
61 -
 62
62 -
63
-
64
-
65
-
66
-
67
-
68
-
69
-
70
-
71
-
72
-
73
-
74
-
75
-
76
-
77
-
78
-
79
-
80
-
81
-
82
-
83
-
84
-
85
-
86
-
87
-
88
-
89
-
90
-
91
-
92
-
93
-
94
-
95
-
96
-
97
-
98
-
99
-
100
-
101
-
102
-
103
-
104
-
105
-
106
-
107
-
108
-
109
-
110
-
111
-
112
-
113
-
114
-
115
-
116
-
117
-
118
-
119
-
120
-
121
-
122
-
123
-
124
-
125
-
126
-
127
-
128
-
129
-
130
-
131
-
132
-
133
-
134
-
135
-
136
-
137
-
138
-
139
-
140
-
141
-
142
-
143
-
144
-
145
-
146
-
147
-
148
-
149
-
150
-
151
-
152
-
153
-
154
-
155
-
156
-
157
-
158
-
159
-
160
 |
 |

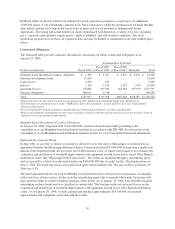
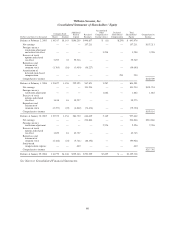
Williams-Sonoma, Inc.
Consolidated Statements of Shareholders’ Equity
Common Stock Additional
Paid-in
Capital
Retained
Earnings
Accumulated
Other
Comprehensive
Income (Loss)
Deferred
Stock-Based
Compensation
Total
Shareholders’
Equity
Comprehensive
IncomeDollars and shares in thousands Shares Amount
Balance at February 2, 2003 114,317 $1,143 $196,259 $446,837 $ (11) $(250) $ 643,978
Net earnings — — — 157,211 — — 157,211 $157,211
Foreign currency
translation adjustment
and related tax effect — — — — 3,298 — 3,298 3,298
Exercise of stock
options and related
tax effect 3,295 33 59,516 — — — 59,549
Repurchase and
retirement of
common stock (1,785) (18) (3,450) (56,227) — — (59,695)
Amortization of
deferred stock-based
compensation — — — — — 250 250
Comprehensive income $160,509
Balance at February 1, 2004 115,827 1,158 252,325 547,821 3,287 — 804,591
Net earnings — — — 191,234 — — 191,234 $191,234
Foreign currency
translation adjustment — — — — 1,882 — 1,882 1,882
Exercise of stock
options and related
tax effect 1,818 18 39,257 — — — 39,275
Repurchase and
retirement of
common stock (2,273) (22) (4,862) (74,436) — — (79,320)
Comprehensive income $193,116
Balance at January 30, 2005 115,372 1,154 286,720 664,619 5,169 — 957,662
Net earnings — — — 214,866 — — 214,866 $214,866
Foreign currency
translation adjustment — — — — 2,526 — 2,526 2,526
Exercise of stock
options and related
tax effect 1,829 18 43,727 — — — 43,745
Repurchase and
retirement of
common stock (2,422) (24) (5,741) (88,156) — — (93,921)
Stock-based
compensation expense — — 440 — — — 440
Comprehensive income $217,392
Balance at January 29, 2006 114,779 $1,148 $325,146 $791,329 $7,695 $ — $1,125,318
See Notes to Consolidated Financial Statements.
40