Pfizer 2015 Annual Report Download - page 96
Download and view the complete annual report
Please find page 96 of the 2015 Pfizer annual report below. You can navigate through the pages in the report by either clicking on the pages listed below, or by using the keyword search tool below to find specific information within the annual report.-
 1
1 -
2
-
3
-
4
-
5
-
6
-
7
-
8
-
9
-
10
-
11
-
12
-
13
-
14
-
15
-
16
-
17
-
18
-
19
-
20
-
21
-
22
-
23
-
24
-
25
-
26
-
27
-
28
-
29
-
30
-
31
-
32
-
33
-
34
-
35
-
36
-
37
-
38
-
39
-
40
-
41
-
42
-
43
-
44
-
45
-
46
-
47
-
48
-
49
-
50
-
51
-
52
-
53
-
54
-
55
-
56
-
57
-
58
-
59
-
60
-
61
-
62
-
63
-
64
-
65
-
66
-
67
-
68
-
69
-
70
-
71
-
72
-
73
-
74
-
75
-
76
-
77
-
78
-
79
-
80
-
81
-
82
-
83
-
84
-
85
-
 86
86 -
 87
87 -
 88
88 -
 89
89 -
 90
90 -
 91
91 -
 92
92 -
 93
93 -
 94
94 -
 95
95 -
 96
96 -
 97
97 -
 98
98 -
 99
99 -
 100
100 -
 101
101 -
 102
102 -
 103
103 -
 104
104 -
 105
105 -
 106
106 -
107
-
108
-
109
-
110
-
111
-
112
-
113
-
114
-
115
-
116
-
117
-
118
-
119
-
120
-
121
-
122
-
123
-
124
-
125
-
126
-
127
-
128
-
129
-
130
-
131
-
132
-
133
-
134
 |
 |

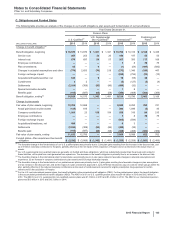
Notes to Consolidated Financial Statements
Pfizer Inc. and Subsidiary Companies
2015 Financial Report
95
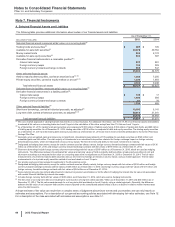
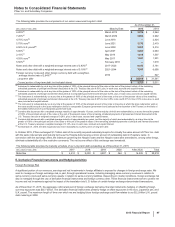
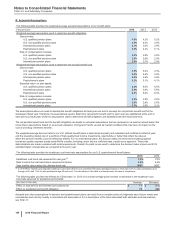
The following methods and assumptions were used to estimate the fair value of our financial assets and liabilities:
• Trading equity securities—quoted market prices.
• Trading debt securities—observable market interest rates.
• Available-for-sale debt securities—third-party matrix-pricing model that uses significant inputs derived from or corroborated by observable
market data and credit-adjusted interest rate yield curves. Loan-backed, receivable-backed, and mortgage-backed securities are valued by
third-party models that use significant inputs derived from observable market data like prepayment rates, default rates, and recovery rates.
• Money market funds—observable Net Asset Value prices.
• Available-for-sale equity securities—third-party pricing services that principally use a composite of observable prices.
• Derivative financial instruments (assets and liabilities)—third-party matrix-pricing model that uses significant inputs derived from or
corroborated by observable market data. Where applicable, these models discount future cash flow amounts using market-based
observable inputs, including interest rate yield curves, and forward and spot prices for currencies. The credit risk impact to our derivative
financial instruments was not significant.
• Held-to-maturity debt securities—third-party matrix-pricing model that uses significant inputs derived from or corroborated by observable
market data and credit-adjusted interest rate yield curves.
• Private equity securities, excluding equity-method investments—application of the implied volatility associated with an observable biotech
index to the carrying amount of our portfolio.
• Short-term borrowings and long-term debt—third-party matrix-pricing model that uses significant inputs derived from or corroborated by
observable market data and our own credit rating.
We periodically review the methodologies, inputs and outputs of third-party pricing services for reasonableness. Our procedures can include,
for example, referencing other third-party pricing models, monitoring key observable inputs (like LIBOR interest rates) and selectively
performing test-comparisons of values with actual sales of financial instruments.
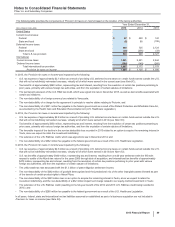
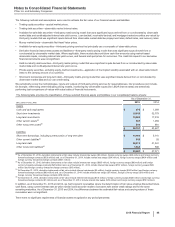
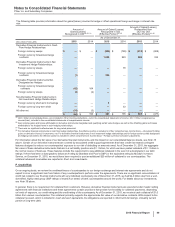
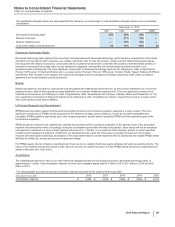
The following table provides the classification of these selected financial assets and liabilities in our consolidated balance sheets:
As of December 31,
(MILLIONS OF DOLLARS) 2015 2014
Assets
Cash and cash equivalents $978 $1,389
Short-term investments 19,649 32,779
Long-term investments 15,999 17,518
Other current assets(a) 587 1,059
Other noncurrent assets(b) 944 881
$38,157 $53,627
Liabilities
Short-term borrowings, including current portion of long-term debt $10,160 $5,141
Other current liabilities(c) 645 93
Long-term debt 28,818 31,541
Other noncurrent liabilities(d) 1,064 596
$40,687 $37,371
(a) As of December 31, 2015, derivative instruments at fair value include interest rate swaps ($2 million), foreign currency swaps ($46 million) and foreign currency
forward-exchange contracts ($538 million) and, as of December 31, 2014, include interest rate swaps ($34 million), foreign currency swaps ($494 million) and
foreign currency forward-exchange contracts ($531 million).
(b) As of December 31, 2015, derivative instruments at fair value include interest rate swaps ($835 million), foreign currency swaps ($89 million) and foreign
currency forward-exchange contracts ($20 million) and, as of December 31, 2014, include interest rate swaps ($767 million), foreign currency swaps ($99
million) and foreign currency forward-exchange contracts ($15 million).
(c) At December 31, 2015, derivative instruments at fair value include interest rate swaps ($5 million), foreign currency swaps ($560 million) and foreign currency
forward-exchange contracts ($80 million) and, as of December 31, 2014, include interest rate swaps ($1 million), foreign currency swaps ($13 million) and
foreign currency forward-exchange contracts ($78 million).
(d) At December 31, 2015, derivative instruments at fair value include interest rate swaps ($134 million), foreign currency swaps ($928 million) and foreign currency
forward-exchange contracts ($1 million) and, as of December 31, 2014, include interest rate swaps ($16 million) and foreign currency swaps ($581 million).
In addition, as of December 31, 2015 and 2014, we had long-term receivables where the determination of fair value employs discounted future
cash flows, using current interest rates at which similar loans would be made to borrowers with similar credit ratings and for the same
remaining maturities. As of December 31, 2015 and 2014, the differences between the estimated fair values and carrying values of these
receivables were not significant.
There were no significant impairments of financial assets recognized in any period presented.