Pfizer 2015 Annual Report Download - page 109
Download and view the complete annual report
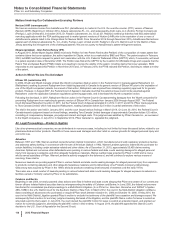
Please find page 109 of the 2015 Pfizer annual report below. You can navigate through the pages in the report by either clicking on the pages listed below, or by using the keyword search tool below to find specific information within the annual report.-
 1
1 -
2
-
3
-
4
-
5
-
6
-
7
-
8
-
9
-
10
-
11
-
12
-
13
-
14
-
15
-
16
-
17
-
18
-
19
-
20
-
21
-
22
-
23
-
24
-
25
-
26
-
27
-
28
-
29
-
30
-
31
-
32
-
33
-
34
-
35
-
36
-
37
-
38
-
39
-
40
-
41
-
42
-
43
-
44
-
45
-
46
-
47
-
48
-
49
-
50
-
51
-
52
-
53
-
54
-
55
-
56
-
57
-
58
-
59
-
60
-
61
-
62
-
63
-
64
-
65
-
66
-
67
-
68
-
69
-
70
-
71
-
72
-
73
-
74
-
75
-
76
-
77
-
78
-
79
-
80
-
81
-
82
-
83
-
84
-
85
-
86
-
87
-
88
-
89
-
90
-
91
-
92
-
93
-
94
-
95
-
96
-
97
-
98
-
 99
99 -
 100
100 -
 101
101 -
 102
102 -
 103
103 -
 104
104 -
 105
105 -
 106
106 -
 107
107 -
 108
108 -
 109
109 -
 110
110 -
 111
111 -
 112
112 -
 113
113 -
 114
114 -
 115
115 -
 116
116 -
 117
117 -
 118
118 -
 119
119 -
120
-
121
-
122
-
123
-
124
-
125
-
126
-
127
-
128
-
129
-
130
-
131
-
132
-
133
-
134
 |
 |

Notes to Consolidated Financial Statements
Pfizer Inc. and Subsidiary Companies
108
2015 Financial Report
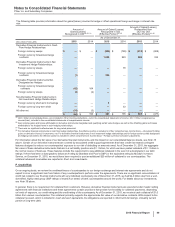
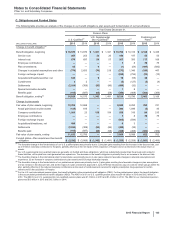
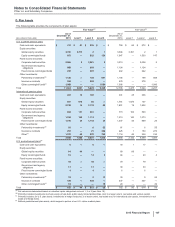
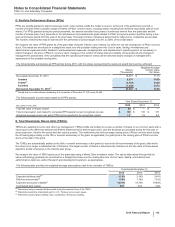
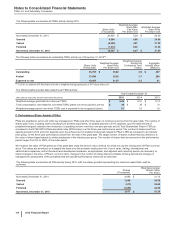
The following table provides an analysis of the changes in our more significant investments valued using significant unobservable inputs:
Year Ended December 31,
U.S. Qualified Pension Plans International Pension Plans
Partnership
investments
Other commingled
funds Insurance contracts Other
(MILLIONS OF DOLLARS) 2015 2014 2015 2014 2015 2014 2015 2014
Fair value, beginning $ 958 $932$1,096 $715 $274 $300 $744 $500
Actual return on plan assets:
Assets held, ending 84 104 (8) 47 16 23 25 47
Assets sold during the period ——(34)(7) ——38
Purchases, sales and settlements, net (51) (78) 35 341 (17)(20)73 254
Transfer into/(out of) Level 3 ———————(19)
Exchange rate changes ————(37)(29)(47)(46)
Fair value, ending $ 991 $958$1,089 $1,096 $236 $274 $798 $744
A single estimate of fair value can result from a complex series of judgments about future events and uncertainties and can rely heavily on
estimates and assumptions. For a description of our general accounting policies associated with developing fair value estimates, see Note 1E.
For a description of the risks associated with estimates and assumptions, see Note 1C.
Specifically, the following methods and assumptions were used to estimate the fair value of our pension and postretirement plans’ assets:
• Cash and cash equivalents, Equity commingled funds, Fixed-income commingled funds––observable prices.
• Global equity securities—quoted market prices.
• Government and agency obligations, Corporate debt securities—observable market prices.
• Other investments—principally unobservable inputs that are significant to the estimation of fair value. These unobservable inputs could
include, for example, the investment managers’ assumptions about earnings multiples and future cash flows.
We periodically review the methodologies, inputs and outputs of third-party pricing services for reasonableness.
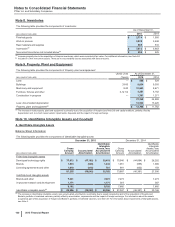
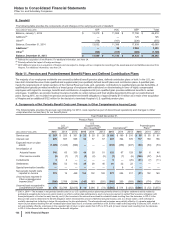
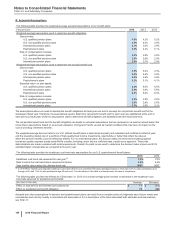
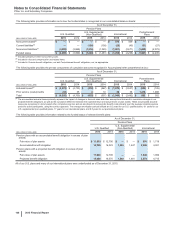
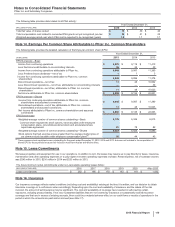
The following table provides the long-term target asset allocations ranges and the percentage of the fair value of plan assets for benefit plans:
As of December 31,
Target
Allocation Percentage Percentage of Plan Assets
(PERCENTAGES) 2015 2015 2014
U.S. qualified pension plans
Cash and cash equivalents 0-10% 3.6% 5.9%
Equity securities 35-55% 40.2%39.7%
Fixed income securities 30-55% 35.0%34.5%
Other investments(a) 5-17.5% 21.2%19.9%
Total 100%100%100%
International pension plans
Cash and cash equivalents 0-10% 2.6% 3.9%
Equity securities 35-55% 39.2%42.3%
Fixed income securities 30-55% 38.8%35.2%
Other investments(a) 5-17.5% 19.4%18.6%
Total 100%100%100%
U.S. postretirement plans
Cash and cash equivalents 0-5% 1.0% 2.4%
Equity securities —12.8%17.4%
Fixed income securities —11.2%15.1%
Other investments 95-100% 75.0%65.1%
Total 100%100%100%
(a) Actual percentage of plan assets in Other Investments for 2015 includes $259 million related to a group fixed annuity insurance contract that was executed by
legacy Wyeth for certain members of its defined benefit plans prior to Pfizer acquiring the company in 2009, and $129 million related to an investment in a
partnership whose primary holdings are public equity securities.