Pfizer 2015 Annual Report Download - page 23
Download and view the complete annual report
Please find page 23 of the 2015 Pfizer annual report below. You can navigate through the pages in the report by either clicking on the pages listed below, or by using the keyword search tool below to find specific information within the annual report.-
 1
1 -
2
-
3
-
4
-
5
-
6
-
7
-
8
-
9
-
10
-
11
-
12
-
 13
13 -
 14
14 -
 15
15 -
 16
16 -
 17
17 -
 18
18 -
 19
19 -
 20
20 -
 21
21 -
 22
22 -
 23
23 -
 24
24 -
 25
25 -
 26
26 -
 27
27 -
 28
28 -
 29
29 -
 30
30 -
 31
31 -
 32
32 -
 33
33 -
34
-
35
-
36
-
37
-
38
-
39
-
40
-
41
-
42
-
43
-
44
-
45
-
46
-
47
-
48
-
49
-
50
-
51
-
52
-
53
-
54
-
55
-
56
-
57
-
58
-
59
-
60
-
61
-
62
-
63
-
64
-
65
-
66
-
67
-
68
-
69
-
70
-
71
-
72
-
73
-
74
-
75
-
76
-
77
-
78
-
79
-
80
-
81
-
82
-
83
-
84
-
85
-
86
-
87
-
88
-
89
-
90
-
91
-
92
-
93
-
94
-
95
-
96
-
97
-
98
-
99
-
100
-
101
-
102
-
103
-
104
-
105
-
106
-
107
-
108
-
109
-
110
-
111
-
112
-
113
-
114
-
115
-
116
-
117
-
118
-
119
-
120
-
121
-
122
-
123
-
124
-
125
-
126
-
127
-
128
-
129
-
130
-
131
-
132
-
133
-
134
 |
 |

Financial Review
Pfizer Inc. and Subsidiary Companies
22
2015 Financial Report
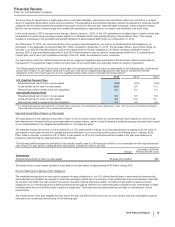
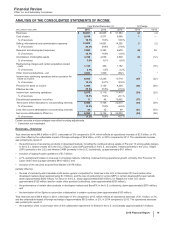
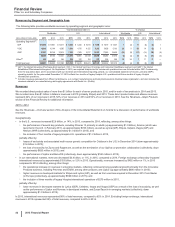
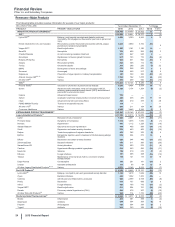
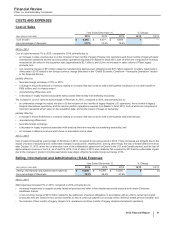
Revenues by Segment and Geographic Area
The following table provides worldwide revenues by operating segment and geographic area:
Year Ended December 31, % Change
Worldwide U.S. International Worldwide U.S. International
(MILLIONS OF DOLLARS) 2015 2014 2013 2015 2014 2013 2015 2014 2013 15/14 14/13 15/14 14/13 15/14 14/13
Operating Segments(a):
GIP $ 13,954 $ 13,861 $ 14,317 $ 6,946 $6,243 $ 6,810 $ 7,008 $ 7,619 $ 7,507 1(3) 11 (8) (8) 1
VOC 12,803 10,144 9,285 7,500 4,715 4,122 5,303 5,428 5,163 26 959 14 (2) 5
GEP 21,587 25,149 27,619 7,030 7,903 9,217 14,557 17,245 18,400 (14) (9) (11) (14) (16) (6)
48,345 49,154 51,221 21,476 18,861 20,149 26,868 30,292 31,070 (2) (4) 14 (6) (11) (3)
Other(b) 506 451 364 228 212 124 279 239 240 12 24 771 17 —
Total revenues $ 48,851 $ 49,605 $ 51,584 $ 21,704 $ 19,073 $ 20,274 $ 27,147 $ 30,532 $ 31,310 (2) (4) 14 (6) (11) (2)
(a) GIP = the Global Innovative Pharmaceutical segment; VOC = the Global Vaccines, Oncology and Consumer Healthcare segment; and GEP = the Global
Established Pharmaceutical segment. On September 3, 2015, we acquired Hospira and its commercial operations are now included within GEP. Commencing
from the acquisition date, and in accordance with our domestic and international reporting periods, our consolidated statement of income, primarily GEP’s
operating results, for the year ended December 31, 2015 reflects four months of legacy Hospira U.S. operations and three months of legacy Hospira
international operations.
(b) Includes revenues generated from Pfizer CentreSource, our contract manufacturing and bulk pharmaceutical chemical sales organization, and also includes the
revenues related to our manufacturing and supply agreements with Zoetis Inc. (Zoetis).
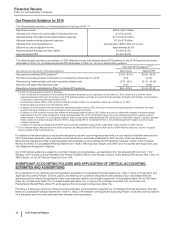
Revenues
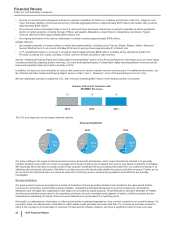
We recorded direct product sales of more than $1 billion for each of seven products in 2015, and for each of ten products in 2014 and 2013.
We recorded more than $1 billion in Alliance revenues in 2015 (primarily Eliquis) and 2013. These direct product sales and alliance revenues
represent 44% of our revenues in 2015, 52% of our revenues in 2014 and 52% of our revenues in 2013. See the Revenues—Major Products
section of this Financial Review for additional information.
2015 v. 2014
See the Revenues—Overview section of this Analysis of the Consolidated Statements of Income for a discussion of performance of worldwide
revenues.
Geographically,
• in the U.S., revenues increased $2.6 billion, or 14%, in 2015, compared to 2014, reflecting, among other things:
the performance of several key products, including Prevnar 13 primarily in adults (up approximately $1.9 billion), Ibrance (which was
launched in the U.S. in February 2015, up approximately $720 million), as well as Lyrica (GIP), Eliquis, Xeljanz, Viagra (GIP) and
Nexium 24HR (collectively, up approximately $1.0 billion in 2015), and
the inclusion of four months of legacy Hospira U.S. operations of $1.2 billion in 2015,
partially offset by:
losses of exclusivity and associated multi-source generic competition for Celebrex in the U.S. in December 2014 (down approximately
$1.6 billion in 2015);
the loss of exclusivity for Zyvox and Rapamune, as well as the termination of our Spiriva co-promotion collaboration (collectively, down
approximately $620 million in 2015); and
the performance of Lipitor and BeneFIX (collectively, down approximately $160 million in 2015).
• in our international markets, revenues decreased $3.4 billion, or 11%, in 2015, compared to 2014. Foreign exchange unfavorably impacted
international revenues by approximately $3.8 billion, or 12% in 2015. Operationally, revenues increased by $402 million or 1%, in 2015
compared to 2014 reflecting, among other things:
the operational increase in revenues in emerging markets, reflecting continued strong operational growth primarily from the Innovative
Products business, including Prevenar and Enbrel, among other products, and Lipitor (up approximately $600 million in 2015);
higher revenues in developed markets for Eliquis and Lyrica (GIP), as well as from vaccines acquired in December 2014 from Baxter
(in Europe) (collectively, up approximately $590 million in 2015); and
the inclusion of three months of legacy Hospira international operations of $270 million in 2015,
partially offset by:
lower revenues in developed markets for Lyrica (GEP), Celebrex, Inspra and Viagra (GEP) as a result of the loss of exclusivity, as well
as the performance of Lipitor and Norvasc in developed markets, and Zosyn/Tazocin in emerging markets (collectively, down
approximately $1.0 billion in 2015).
In 2015, international revenues represented 56% of total revenues, compared to 62% in 2014. Excluding foreign exchange, international
revenues in 2015 represented 59% of total revenues, compared to 62% in 2014.