Pfizer 2015 Annual Report Download - page 32
Download and view the complete annual report
Please find page 32 of the 2015 Pfizer annual report below. You can navigate through the pages in the report by either clicking on the pages listed below, or by using the keyword search tool below to find specific information within the annual report.-
 1
1 -
2
-
3
-
4
-
5
-
6
-
7
-
8
-
9
-
10
-
11
-
12
-
13
-
14
-
15
-
16
-
17
-
18
-
19
-
20
-
21
-
 22
22 -
 23
23 -
 24
24 -
 25
25 -
 26
26 -
 27
27 -
 28
28 -
 29
29 -
 30
30 -
 31
31 -
 32
32 -
 33
33 -
 34
34 -
 35
35 -
 36
36 -
 37
37 -
 38
38 -
 39
39 -
 40
40 -
 41
41 -
 42
42 -
43
-
44
-
45
-
46
-
47
-
48
-
49
-
50
-
51
-
52
-
53
-
54
-
55
-
56
-
57
-
58
-
59
-
60
-
61
-
62
-
63
-
64
-
65
-
66
-
67
-
68
-
69
-
70
-
71
-
72
-
73
-
74
-
75
-
76
-
77
-
78
-
79
-
80
-
81
-
82
-
83
-
84
-
85
-
86
-
87
-
88
-
89
-
90
-
91
-
92
-
93
-
94
-
95
-
96
-
97
-
98
-
99
-
100
-
101
-
102
-
103
-
104
-
105
-
106
-
107
-
108
-
109
-
110
-
111
-
112
-
113
-
114
-
115
-
116
-
117
-
118
-
119
-
120
-
121
-
122
-
123
-
124
-
125
-
126
-
127
-
128
-
129
-
130
-
131
-
132
-
133
-
134
 |
 |

Financial Review
Pfizer Inc. and Subsidiary Companies
2015 Financial Report
31
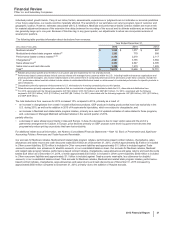
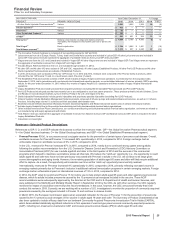
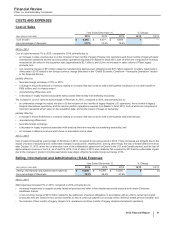
COSTS AND EXPENSES
Cost of Sales
Year Ended December 31, % Change
(MILLIONS OF DOLLARS) 2015 2014 2013 15/14 14/13
Cost of sales $9,648 $9,577 $9,586 1—
As a percentage of Revenues 19.7% 19.3%18.6%
2015 v. 2014
Cost of sales increased 1% in 2015, compared to 2014, primarily due to:
• an increase in sales volumes due to (i) the inclusion of four months of legacy Hospira U.S. operations and three months of legacy Hospira
international operations and the vaccine portfolio operations acquired from Baxter in fiscal 2015, both of which are comprised of inventory
measured at fair value on the acquisition date (approximately $2.1 billion); and (ii) the net increase in sales volume of Pfizer legacy
products; and
• non-recurring charges of $72 million related to manufacturing plant pension obligations and $72 million related to inventory impairment in
Venezuela in 2015 related to the foreign currency change described in the “Global Economic Conditions—Venezuela Operations” section
in this Financial Review,
partially offset by:
• favorable foreign exchange of 10% in 2015;
• a change in the profit deferred in inventory relating to inventory that had not been sold to third parties resulting in a non-cash benefit of
$306 million; and, to a lesser extent
• manufacturing efficiencies; and
• a decrease in royalty expense associated with products that recently lost marketing exclusivity.
The increase in Cost of sales as a percentage of Revenues in 2015, compared to 2014, was primarily due to:
• an unfavorable change in product mix due to (i) the inclusion of four months of legacy Hospira U.S. operations, three months of legacy
Hospira international operations, and the vaccine portfolio operations acquired from Baxter in fiscal 2015, both of which are comprised of
inventory measured at fair value on the acquisition date; and (ii) the impact of losses of exclusivity;
partially offset by:
• a change in the profit deferred in inventory relating to inventory that had not been sold to third parties (described above);
• manufacturing efficiencies;
• favorable foreign exchange;
• a decrease in royalty expenses associated with products that have recently lost marketing exclusivity; and
• an increase in alliance revenues which have no associated cost of sales.
2014 v. 2013
Cost of sales increased as a percentage of Revenues in 2014, compared to the same period in 2013. These increases are primarily due to the
impact of losses of exclusivity and unfavorable changes in product mix, resulting from, among other things, the loss of Enbrel alliance revenue
after October 31, 2013, when the co-promotion term of the collaboration agreement for Enbrel in the U.S. and Canada expired, and the loss of
Spiriva alliance revenue in the U.S. as of April 29, 2014. Cost of sales in 2014 were relatively flat compared to 2013 as the unfavorable impact
due to the changes in product mix discussed above was largely offset by favorable foreign exchange of 3%.
Selling, Informational and Administrative (SI&A) Expenses
Year Ended December 31, % Change
(MILLIONS OF DOLLARS) 2015 2014 2013 15/14 14/13
Selling, informational and administrative expenses $14,809 $ 14,097 $ 14,355 5(2)
As a percentage of Revenues 30.3%28.4%27.8%
2015 v. 2014
SI&A expenses increased 5% in 2015, compared to 2014, primarily due to:
• increased investments to support recently launched products and other in-line biopharmaceutical products and certain Consumer
Healthcare brands;
• a non-recurring charge of $419 million related to the settlement of pension obligations in accordance with an offer to certain terminated
employees who are vested in their pension benefits to elect a lump-sum payment or annuity of their deferred vested pension benefits; and
• the inclusion of four months of legacy Hospira U.S. operations and three months of legacy Hospira international operations,