Pfizer 2015 Annual Report Download - page 45
Download and view the complete annual report
Please find page 45 of the 2015 Pfizer annual report below. You can navigate through the pages in the report by either clicking on the pages listed below, or by using the keyword search tool below to find specific information within the annual report.-
 1
1 -
2
-
3
-
4
-
5
-
6
-
7
-
8
-
9
-
10
-
11
-
12
-
13
-
14
-
15
-
16
-
17
-
18
-
19
-
20
-
21
-
22
-
23
-
24
-
25
-
26
-
27
-
28
-
29
-
30
-
31
-
32
-
33
-
34
-
 35
35 -
 36
36 -
 37
37 -
 38
38 -
 39
39 -
 40
40 -
 41
41 -
 42
42 -
 43
43 -
 44
44 -
 45
45 -
 46
46 -
 47
47 -
 48
48 -
 49
49 -
 50
50 -
 51
51 -
 52
52 -
 53
53 -
 54
54 -
 55
55 -
56
-
57
-
58
-
59
-
60
-
61
-
62
-
63
-
64
-
65
-
66
-
67
-
68
-
69
-
70
-
71
-
72
-
73
-
74
-
75
-
76
-
77
-
78
-
79
-
80
-
81
-
82
-
83
-
84
-
85
-
86
-
87
-
88
-
89
-
90
-
91
-
92
-
93
-
94
-
95
-
96
-
97
-
98
-
99
-
100
-
101
-
102
-
103
-
104
-
105
-
106
-
107
-
108
-
109
-
110
-
111
-
112
-
113
-
114
-
115
-
116
-
117
-
118
-
119
-
120
-
121
-
122
-
123
-
124
-
125
-
126
-
127
-
128
-
129
-
130
-
131
-
132
-
133
-
134
 |
 |

Financial Review
Pfizer Inc. and Subsidiary Companies
44
2015 Financial Report
(iv) Corporate—the costs associated with Corporate, representing platform functions (such as worldwide technology, global real estate operations, legal, finance,
human resources, worldwide public affairs, compliance, and worldwide procurement) and certain compensation and other corporate costs, such as interest
income and expense, and gains and losses on investments.
(v) Other Unallocated—other unallocated costs, representing overhead expenses associated with our manufacturing and commercial operations not directly
attributable to an operating segment.
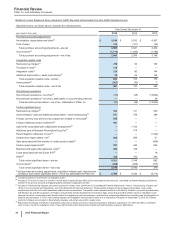
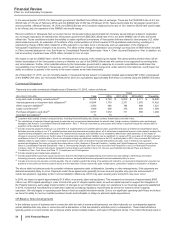
For information purposes only, for 2015, we estimate that Other costs, in the aggregate and as described above, but excluding (i) the revenues and costs
associated with PCS; (ii) net interest-related expense not attributable to an operating segment and included in Corporate (approximately $831 million in Other
(income)/deductions––net); and (iii) net gains on investments not attributable to an operating segment and included in Corporate (approximately $104 million in
Other (income)/deductions––net), are generally associated with our operating segments, as follows:
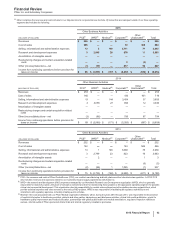
(PERCENTAGES) GIP VOC GEP
WRD/Medical Costs
Selling, informational and administrative expenses 55% - 57% 17% - 19% 24% - 26%
Research and development expenses 49% - 53% 35% - 38% 12% - 14%
Other (income)/deductions––net * * *
Total WRD/Medical Costs 48% - 52% 35% - 38% 13% - 15%
Corporate/Other Unallocated Costs
Cost of sales (12%) - (14%) (9%) - (11%) 118% - 120%
Selling, informational and administrative expenses 27% - 29% 24% - 26% 44% - 48%
Research and development expenses 46% - 50% 37% - 40% 13% - 15%
Other (income)/deductions––net * * *
Total Corporate/Other Unallocated Costs 26% - 29% 22% - 25% 46% - 49%
Total WRD/Medical and Corporate/Other Unallocated Costs
Cost of sales (12%) - (14%) (9%) - (11%) 118% - 120%
Selling, informational and administrative expenses 28% - 30% 24% - 26% 43% - 47%
Research and development expenses 48% - 52% 35% - 38% 13% - 15%
Other (income)/deductions––net * * *
Total WRD/Medical and Corporate/Other Unallocated Costs 34% - 37% 27% - 30% 34% - 37%
* Amounts not material. After excluding net interest expense included in Corporate and net gains on investments not attributable to an operating segment and
included in Corporate, Other (income)/deductions––net approximates $97 million of expense.
The percentages provided in the table above do not purport to reflect the additional amounts that each of our operating segments would have incurred had
each segment operated as a standalone company during the period presented.
• WRD/Medical––The information provided in the table above for WRD and Medical was substantially all derived from our estimates of the costs incurred in
connection with the R&D projects associated with each operating segment.
• Corporate/Other Unallocated––Virtually all of the information provided in the table above for Corporate and Other Unallocated was derived using
proportional allocation methods based on global, regional or country revenues or global, regional or country headcount, as well as certain cost metrics, as
appropriate, such as those derived from R&D and manufacturing costs. Management believes that the allocations of Corporate and Other Unallocated
costs are reasonable.
(d) See the “Adjusted Income” section of this Financial Review for a definition of these “Adjusted Income” components.
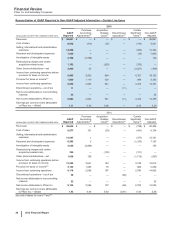
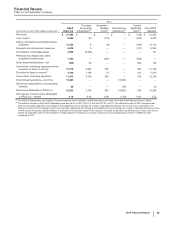
(e) Includes costs associated with (i) purchase accounting adjustments; (ii) acquisition-related costs; and (iii) certain significant items, which are substantive,
unusual items that are evaluated on an individual basis by management. For additional information about these reconciling items and/or our Non-GAAP
Adjusted measure of performance, see the “Adjusted Income” section of this Financial Review.
(f) As our operations were not managed under the new structure until the beginning of the first quarter of 2014, certain costs and expenses could not be directly
attributed to one of the new operating segments. As a result, our operating segment results for 2013 include allocations. The amounts subject to allocation
methods in 2013 were approximately $2.1 billion, of selling, informational and administrative expenses and approximately $800 million, of R&D expenses.
• The selling, informational and administrative expenses were allocated using proportional allocation methods based on associated selling costs, revenues or
product-specific costs, as applicable.
• The R&D expenses were allocated based on product-specific R&D costs or revenue metrics, as applicable.
Management believes that the allocations are reasonable.
* Calculation not meaningful.
Global Innovative Pharmaceutical Operating Segment
2015 vs. 2014
• Revenues increased 1% in 2015, compared to 2014. Foreign exchange had an unfavorable impact of 8% on GIP revenues in 2015,
compared to 2014. Revenues increased by 9% operationally in 2015, compared to 2014, primarily due to the following operational factors:
strong operational performance of Eliquis globally, Lyrica, primarily in the U.S. and Japan, as well as Xeljanz, Viagra and Chantix, all
primarily in the U.S. (collectively, up approximately $1.5 billion in 2015),
partially offset by:
a decline in Rapamune revenues in the U.S. due to generic competition which began in October 2014 (down approximately $120 million
in 2015), and
declines in the hemophilia portfolio in the U.S. due to increased competition (collectively down approximately $100 million).