Pfizer 2015 Annual Report Download - page 107
Download and view the complete annual report
Please find page 107 of the 2015 Pfizer annual report below. You can navigate through the pages in the report by either clicking on the pages listed below, or by using the keyword search tool below to find specific information within the annual report.-
 1
1 -
2
-
3
-
4
-
5
-
6
-
7
-
8
-
9
-
10
-
11
-
12
-
13
-
14
-
15
-
16
-
17
-
18
-
19
-
20
-
21
-
22
-
23
-
24
-
25
-
26
-
27
-
28
-
29
-
30
-
31
-
32
-
33
-
34
-
35
-
36
-
37
-
38
-
39
-
40
-
41
-
42
-
43
-
44
-
45
-
46
-
47
-
48
-
49
-
50
-
51
-
52
-
53
-
54
-
55
-
56
-
57
-
58
-
59
-
60
-
61
-
62
-
63
-
64
-
65
-
66
-
67
-
68
-
69
-
70
-
71
-
72
-
73
-
74
-
75
-
76
-
77
-
78
-
79
-
80
-
81
-
82
-
83
-
84
-
85
-
86
-
87
-
88
-
89
-
90
-
91
-
92
-
93
-
94
-
95
-
96
-
 97
97 -
 98
98 -
 99
99 -
 100
100 -
 101
101 -
 102
102 -
 103
103 -
 104
104 -
 105
105 -
 106
106 -
 107
107 -
 108
108 -
 109
109 -
 110
110 -
 111
111 -
 112
112 -
 113
113 -
 114
114 -
 115
115 -
 116
116 -
 117
117 -
118
-
119
-
120
-
121
-
122
-
123
-
124
-
125
-
126
-
127
-
128
-
129
-
130
-
131
-
132
-
133
-
134
 |
 |

Notes to Consolidated Financial Statements
Pfizer Inc. and Subsidiary Companies
106
2015 Financial Report
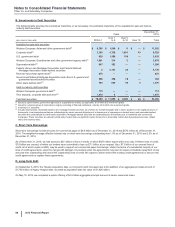
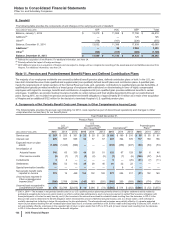
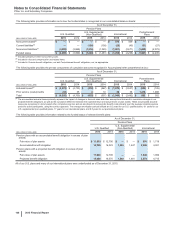
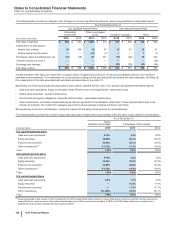
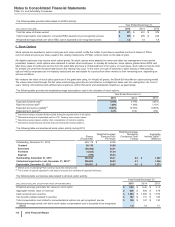
The following table provides information as to how the funded status is recognized in our consolidated balance sheets:
As of December 31,
Pension Plans
U.S. Qualified U.S. Supplemental
(Non-Qualified) International Postretirement
Plans
(MILLIONS OF DOLLARS) 2015 2014 2015 2014 2015 2014 2015 2014
Noncurrent assets(a) $—$—$—$—$572 $509 $—$—
Current liabilities(b) ——(126)(136)(25)(45)(31)(27)
Noncurrent liabilities(c) (3,292) (3,869) (1,216)(1,345) (1,801) (2,671) (1,809)(2,379)
Funded status $ (3,292) $ (3,869) $(1,343)$ (1,481) $ (1,255) $ (2,208) $(1,841)$(2,406)
(a) Included primarily in Other noncurrent assets.
(b) Included in Accrued compensation and related items.
(c) Included in Pension benefit obligations, net and Postretirement benefit obligations, net, as appropriate.
The following table provides the pre-tax components of cumulative amounts recognized in Accumulated other comprehensive loss:
As of December 31,
Pension Plans
U.S. Qualified U.S. Supplemental
(Non-Qualified) International Postretirement
Plans
(MILLIONS OF DOLLARS) 2015 2014 2015 2014 2015 2014 2015 2014
Actuarial losses(a) $ (4,272) $ (4,735) $(419)$(567)$ (1,979) $ (2,527) $(523)$(745)
Prior service (costs)/credits (33) 35 410 29 36 1,415 1,098
Total $ (4,305) $ (4,700) $(415)$(557)$ (1,949) $ (2,492) $892 $352
(a) The accumulated actuarial losses primarily represent the impact of changes in discount rates and other assumptions that result in cumulative changes in our
projected benefit obligations, as well as the cumulative difference between the expected return and actual return on plan assets. These accumulated actuarial
losses are recognized in Accumulated other comprehensive loss and are amortized into net periodic benefit costs primarily over the average remaining service
period for active participants, using the corridor approach. The average amortization periods utilized are 8.2 years for our U.S. qualified plans, 8.1 years for our
U.S. supplemental (non-qualified) plans, 17 years for our international plans, and 9.5 years for our postretirement plans.
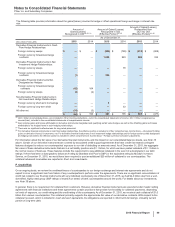
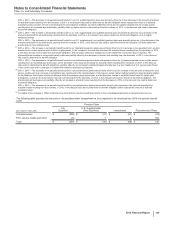
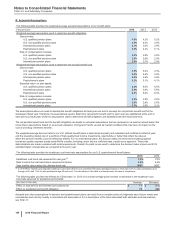
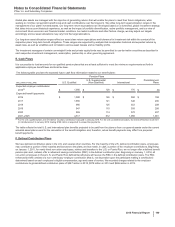
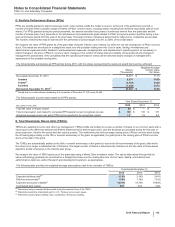
The following table provides information related to the funded status of selected benefit plans:
As of December 31,
Pension Plans
U.S. Qualified
U.S. Supplemental
(Non-Qualified) International
(MILLIONS OF DOLLARS) 2015 2014 2015 2014 2015 2014
Pension plans with an accumulated benefit obligation in excess of plan
assets:
Fair value of plan assets $ 11,633 $ 12,706 $—$—$ 976 $ 1,718
Accumulated benefit obligation 14,755 16,323 1,324 1,447 2,495 4,021
Pension plans with a projected benefit obligation in excess of plan
assets:
Fair value of plan assets 11,633 12,706 ——1,546 1,999
Projected benefit obligation 14,926 16,575 1,343 1,481 3,373 4,715
All of our U.S. plans and many of our international plans were underfunded as of December 31, 2015.