Pfizer 2015 Annual Report Download - page 105
Download and view the complete annual report
Please find page 105 of the 2015 Pfizer annual report below. You can navigate through the pages in the report by either clicking on the pages listed below, or by using the keyword search tool below to find specific information within the annual report.-
 1
1 -
2
-
3
-
4
-
5
-
6
-
7
-
8
-
9
-
10
-
11
-
12
-
13
-
14
-
15
-
16
-
17
-
18
-
19
-
20
-
21
-
22
-
23
-
24
-
25
-
26
-
27
-
28
-
29
-
30
-
31
-
32
-
33
-
34
-
35
-
36
-
37
-
38
-
39
-
40
-
41
-
42
-
43
-
44
-
45
-
46
-
47
-
48
-
49
-
50
-
51
-
52
-
53
-
54
-
55
-
56
-
57
-
58
-
59
-
60
-
61
-
62
-
63
-
64
-
65
-
66
-
67
-
68
-
69
-
70
-
71
-
72
-
73
-
74
-
75
-
76
-
77
-
78
-
79
-
80
-
81
-
82
-
83
-
84
-
85
-
86
-
87
-
88
-
89
-
90
-
91
-
92
-
93
-
94
-
 95
95 -
 96
96 -
 97
97 -
 98
98 -
 99
99 -
 100
100 -
 101
101 -
 102
102 -
 103
103 -
 104
104 -
 105
105 -
 106
106 -
 107
107 -
 108
108 -
 109
109 -
 110
110 -
 111
111 -
 112
112 -
 113
113 -
 114
114 -
 115
115 -
116
-
117
-
118
-
119
-
120
-
121
-
122
-
123
-
124
-
125
-
126
-
127
-
128
-
129
-
130
-
131
-
132
-
133
-
134
 |
 |

Notes to Consolidated Financial Statements
Pfizer Inc. and Subsidiary Companies
104
2015 Financial Report
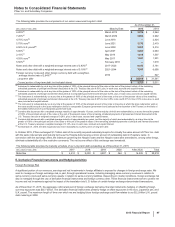
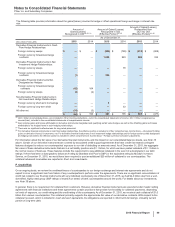
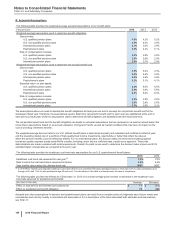
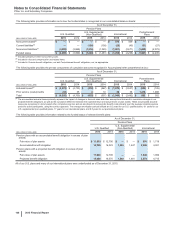
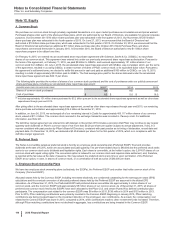
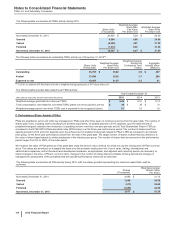
B. Actuarial Assumptions
The following table provides the weighted-average actuarial assumptions of our benefit plans:
(PERCENTAGES) 2015 2014 2013
Weighted-average assumptions used to determine benefit obligations
Discount rate:
U.S. qualified pension plans 4.5% 4.2% 5.2%
U.S. non-qualified pension plans 4.5% 4.0% 4.8%
International pension plans 3.1% 3.0% 3.9%
Postretirement plans 4.5% 4.2% 5.1%
Rate of compensation increase:
U.S. qualified pension plans 2.8% 2.8% 2.8%
U.S. non-qualified pension plans 2.8% 2.8% 2.8%
International pension plans 2.6% 2.7% 2.9%
Weighted-average assumptions used to determine net periodic benefit cost
Discount rate:
U.S. qualified pension plans 4.2% 5.2% 4.3%
U.S. non-qualified pension plans 4.0% 4.8% 3.9%
International pension plans 3.0% 3.9% 3.8%
Postretirement plans 4.2% 5.1% 4.1%
Expected return on plan assets:
U.S. qualified pension plans 8.3% 8.5% 8.5%
International pension plans 5.5% 5.8% 5.6%
Postretirement plans 8.3% 8.5% 8.5%
Rate of compensation increase:
U.S. qualified pension plans 2.8% 2.8% 2.8%
U.S. non-qualified pension plans 2.8% 2.8% 2.8%
International pension plans 2.7% 2.9% 3.1%
The assumptions above are used to develop the benefit obligations at fiscal year-end and to develop the net periodic benefit cost for the
subsequent fiscal year. Therefore, the assumptions used to determine net periodic benefit cost for each year are established at the end of
each previous fiscal year, while the assumptions used to determine benefit obligations are established at each fiscal year-end.
The net periodic benefit cost and the benefit obligations are based on actuarial assumptions that are reviewed on at least an annual basis. We
revise these assumptions based on an annual evaluation of long-term trends, as well as market conditions that may have an impact on the
cost of providing retirement benefits.
The weighted-average discount rate for our U.S. defined benefit plans is determined annually and evaluated and modified to reflect at year-
end the prevailing market rate of a portfolio of high-quality fixed income investments, rated AA/Aa or better that reflect the rates at
which the pension benefits could be effectively settled. For our international plans, the discount rates are set by benchmarking against
investment grade corporate bonds rated AA/Aa or better, including, when there is sufficient data, a yield curve approach. These rate
determinations are made consistent with local requirements. Overall, the yield curves used to determine the discount rates at year-end 2015
exhibited higher interest rates as compared to the prior year.
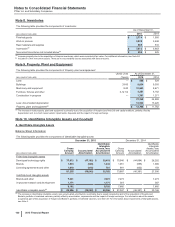
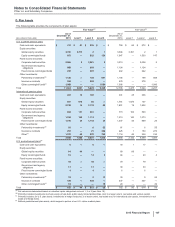
The following table provides the healthcare cost trend rate assumptions for our U.S. postretirement benefit plans:
2015 2014
Healthcare cost trend rate assumed for next year(a) 7.4% 7.0%
Rate to which the cost trend rate is assumed to decline 4.5% 4.5%
Year that the rate reaches the ultimate trend rate 2037 2027
(a) In 2015 Pfizer started using separate healthcare cost trend rates for U.S. postretirement plan participants based on their age (6.5% for plan participants up to
the age of 65, and 7.9% for plan participants age 65 and over). The rate shown in the table is a blended rate, for ease of comparison.
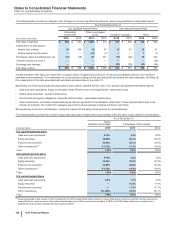
The following table provides the effects as of December 31, 2015 of a one-percentage-point increase or decrease in the healthcare cost
trend rate assumed for postretirement benefits:
(MILLIONS OF DOLLARS) Increase Decrease
Effect on total service and interest cost components $11$
(11)
Effect on postretirement benefit obligation 77 (80)
Actuarial and other assumptions for pension and postretirement plans can result from a complex series of judgments about future events and
uncertainties and can rely heavily on estimates and assumptions. For a description of the risks associated with estimates and assumptions,
see Note 1C.