Pfizer 2015 Annual Report Download - page 95
Download and view the complete annual report
Please find page 95 of the 2015 Pfizer annual report below. You can navigate through the pages in the report by either clicking on the pages listed below, or by using the keyword search tool below to find specific information within the annual report.-
 1
1 -
2
-
3
-
4
-
5
-
6
-
7
-
8
-
9
-
10
-
11
-
12
-
13
-
14
-
15
-
16
-
17
-
18
-
19
-
20
-
21
-
22
-
23
-
24
-
25
-
26
-
27
-
28
-
29
-
30
-
31
-
32
-
33
-
34
-
35
-
36
-
37
-
38
-
39
-
40
-
41
-
42
-
43
-
44
-
45
-
46
-
47
-
48
-
49
-
50
-
51
-
52
-
53
-
54
-
55
-
56
-
57
-
58
-
59
-
60
-
61
-
62
-
63
-
64
-
65
-
66
-
67
-
68
-
69
-
70
-
71
-
72
-
73
-
74
-
75
-
76
-
77
-
78
-
79
-
80
-
81
-
82
-
83
-
84
-
 85
85 -
 86
86 -
 87
87 -
 88
88 -
 89
89 -
 90
90 -
 91
91 -
 92
92 -
 93
93 -
 94
94 -
 95
95 -
 96
96 -
 97
97 -
 98
98 -
 99
99 -
 100
100 -
 101
101 -
 102
102 -
 103
103 -
 104
104 -
 105
105 -
106
-
107
-
108
-
109
-
110
-
111
-
112
-
113
-
114
-
115
-
116
-
117
-
118
-
119
-
120
-
121
-
122
-
123
-
124
-
125
-
126
-
127
-
128
-
129
-
130
-
131
-
132
-
133
-
134
 |
 |

Notes to Consolidated Financial Statements
Pfizer Inc. and Subsidiary Companies
94
2015 Financial Report
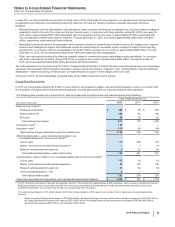
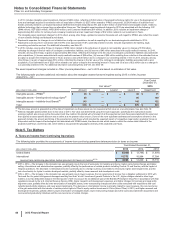
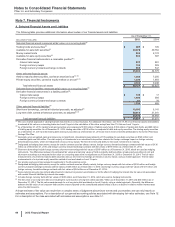
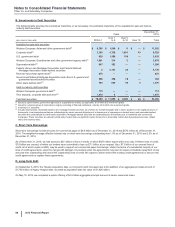
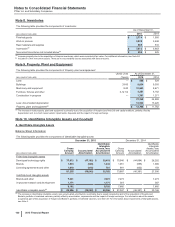
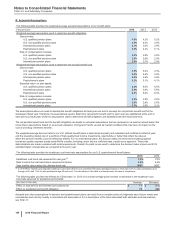
Note 7. Financial Instruments
A. Selected Financial Assets and Liabilities
The following table provides additional information about certain of our financial assets and liabilities:
As of December 31,
(MILLIONS OF DOLLARS) 2015 2014
Selected financial assets measured at fair value on a recurring basis(a)
Trading funds and securities(b) $287 $105
Available-for-sale debt securities(c) 32,078 39,762
Money market funds 934 2,174
Available-for-sale equity securities(c) 603 397
Derivative financial instruments in a receivable position(d):
Interest rate swaps 837 801
Foreign currency swaps 135 593
Foreign currency forward-exchange contracts 559 547
35,433 44,379
Other selected financial assets
Held-to-maturity debt securities, carried at amortized cost(c), (e) 1,388 7,255
Private equity securities, carried at equity-method or at cost(e), (f) 1,336 1,993
2,724 9,248
Total selected financial assets $ 38,157 $ 53,627
Selected financial liabilities measured at fair value on a recurring basis(a)
Derivative financial instruments in a liability position(g):
Interest rate swaps $ 139 $17
Foreign currency swaps 1,489 594
Foreign currency forward-exchange contracts 81 78
1,709 689
Other selected financial liabilities(h)
Short-term borrowings, carried at historical proceeds, as adjusted(e) 10,160 5,141
Long-term debt, carried at historical proceeds, as adjusted(i), (j) 28,818 31,541
38,978 36,682
Total selected financial liabilities $ 40,687 $ 37,371
(a) We use a market approach in valuing financial instruments on a recurring basis. For additional information, see Note 1E. All of our financial assets and liabilities
measured at fair value on a recurring basis use Level 2 inputs in the calculation of fair value, except less than 1% that use Level 1 inputs.
(b) As of December 31, 2015, trading funds and securities are composed of $100 million of trading equity funds, $102 million of trading debt funds, and $85 million
of trading equity securities. As of December 31, 2014, trading securities of $105 million is composed of debt and equity securities. The trading equity securities
as of December 31, 2015 and the trading debt and equity securities as of December 31, 2014 are held in trust for benefits attributable to the former Pharmacia
Savings Plus Plan.
(c) Generally, gross unrealized gains and losses are not significant. Unrealized losses related to 2015 available-for-sale debt securities are $593 million and
unrealized gains are $44 million. The vast majority of investments in an unrealized loss position relate to the foreign exchange impact on foreign currency
denominated securities, which are hedged with cross-currency swaps. We have the intent and ability to hold such investments to maturity.
(d) Designated as hedging instruments, except for certain contracts used as offsets; namely, foreign currency forward-exchange contracts with fair values of $136
million as of December 31, 2015; and foreign currency forward-exchange contracts with fair values of $159 million as of December 31, 2014.
(e) Short-term borrowings include foreign currency short-term borrowings with fair values of $547 million as of December 31, 2015, which are used as hedging
instruments. The differences between the estimated fair values and carrying values of held-to-maturity debt securities, private equity securities at cost and
short-term borrowings not measured at fair value on a recurring basis were not significant as of December 31, 2015 or December 31, 2014. The fair value
measurements of our held-to-maturity debt securities and our short-term borrowings are based on Level 2 inputs, using a market approach. The fair value
measurements of our private equity securities carried at cost are based on Level 3 inputs.
(f) Our private equity securities represent investments in the life sciences sector.
(g) Designated as hedging instruments, except for certain contracts used as offsets; namely, foreign currency swaps with fair values of $234 million and foreign
currency forward-exchange contracts with fair values of $59 million as of December 31, 2015; and foreign currency swaps with fair values of $121 million and
foreign currency forward-exchange contracts with fair values of $54 million as of December 31, 2014.
(h) Some carrying amounts may include adjustments for discount or premium amortization or for the effect of hedging the interest rate fair value risk associated
with certain financial liabilities by interest rate swaps.
(i) Includes foreign currency debt with fair values of $560 million as of December 31, 2014, which are used as hedging instruments.
(j) The fair value of our long-term debt (not including the current portion of long-term debt) was $32.7 billion as of December 31, 2015 and $36.6 billion as of
December 31, 2014. The fair value measurements for our long-term debt are based on Level 2 inputs, using a market approach. Generally, the difference
between the fair value of our long-term debt and the amount reported on the consolidated balance sheet is due to a decline in relative market interest rates
since the debt issuance.
A single estimate of fair value can result from a complex series of judgments about future events and uncertainties and can rely heavily on
estimates and assumptions. For a description of our general accounting policies associated with developing fair value estimates, see Note 1E.
For a description of the risks associated with estimates and assumptions, see Note 1C.