Pfizer 2015 Annual Report Download - page 104
Download and view the complete annual report
Please find page 104 of the 2015 Pfizer annual report below. You can navigate through the pages in the report by either clicking on the pages listed below, or by using the keyword search tool below to find specific information within the annual report.-
 1
1 -
2
-
3
-
4
-
5
-
6
-
7
-
8
-
9
-
10
-
11
-
12
-
13
-
14
-
15
-
16
-
17
-
18
-
19
-
20
-
21
-
22
-
23
-
24
-
25
-
26
-
27
-
28
-
29
-
30
-
31
-
32
-
33
-
34
-
35
-
36
-
37
-
38
-
39
-
40
-
41
-
42
-
43
-
44
-
45
-
46
-
47
-
48
-
49
-
50
-
51
-
52
-
53
-
54
-
55
-
56
-
57
-
58
-
59
-
60
-
61
-
62
-
63
-
64
-
65
-
66
-
67
-
68
-
69
-
70
-
71
-
72
-
73
-
74
-
75
-
76
-
77
-
78
-
79
-
80
-
81
-
82
-
83
-
84
-
85
-
86
-
87
-
88
-
89
-
90
-
91
-
92
-
93
-
 94
94 -
 95
95 -
 96
96 -
 97
97 -
 98
98 -
 99
99 -
 100
100 -
 101
101 -
 102
102 -
 103
103 -
 104
104 -
 105
105 -
 106
106 -
 107
107 -
 108
108 -
 109
109 -
 110
110 -
 111
111 -
 112
112 -
 113
113 -
 114
114 -
115
-
116
-
117
-
118
-
119
-
120
-
121
-
122
-
123
-
124
-
125
-
126
-
127
-
128
-
129
-
130
-
131
-
132
-
133
-
134
 |
 |

Notes to Consolidated Financial Statements
Pfizer Inc. and Subsidiary Companies
2015 Financial Report
103
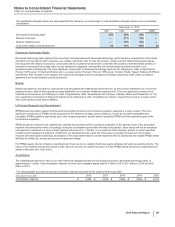
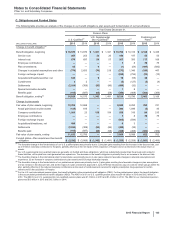
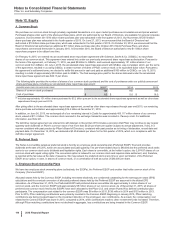
2014 v. 2013––The decrease in net periodic benefit costs for our U.S. qualified pension plans was primarily driven by (i) the decrease in the amounts amortized
for actuarial losses resulting from the increase, in 2013, in the discount rate used to determine the benefit obligation (which reduced the amount of deferred
actuarial losses), (ii) lower service cost resulting from cost-reduction initiatives, (iii) lower settlement activity and (iv) greater expected return on plan assets
resulting from an increased plan asset base, partially offset by higher interest costs resulting from the increase, in 2013, in the discount rate used to determine
the benefit obligation.
(b) 2015 v. 2014––The increase in net periodic benefit costs for our U.S. supplemental (non-qualified) pension plans was primarily driven by (i) an increase in the
amounts amortized for actuarial losses resulting from the decrease, in 2014, in the discount rate used to determine the benefit obligation, and (ii) higher
settlement activity.
2014 v. 2013––The decrease in net periodic benefit costs for our U.S. supplemental (non-qualified) pension plans was primarily driven by (i) the decrease in the
amounts amortized for actuarial losses resulting from the increase, in 2013, in the discount rate used to determine the benefit obligation, (ii) lower settlement
activity and (iii) lower interest costs.
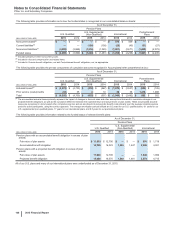
(c) 2015 v. 2014––The increase in net periodic benefit costs for our international pension plans was primarily driven by (i) a decrease in the expected return on plan
assets due to a lower expected rate of return on plan assets, (ii) an increase in the amounts amortized for actuarial losses resulting from the decrease, in 2014,
in the discount rate used to determine the benefit obligation, and (iii) higher settlement charges due to the settlement of a pension plan in Sweden. The
aforementioned increase in net periodic benefit costs was partially offset by the decrease in interest cost resulting from the decrease, in 2014, in the discount
rate used to determine the benefit obligation.
2014 v. 2013––The decrease in net periodic benefit costs for our international pension plans was primarily driven by (i) greater expected return on plan assets
resulting from an increased plan asset base, (ii) the decrease in the amounts amortized for actuarial losses resulting from increases, in 2013, in the discount
rates used to determine the benefit obligations, partially offset by (iii) increased curtailment losses primarily due to a loss relating to a U.K. pension plan freeze
in the current year and (iv) changes in curtailments related to restructuring initiatives.
(d) 2015 v. 2014––The decrease in net periodic benefit costs for our postretirement plans was primarily driven by (i) the increase in the amounts amortized for prior
service credits and (ii) an increase in curtailment gain resulting from the implementation of changes to certain retiree medical benefits to adopt programs eligible
for the Medicare Part D plan subsidy, as allowed under the employer group waiver plan, and another plan change to establish benefit caps for certain plan
participants, as well as (iii) a decrease in interest cost resulting from the decrease, in 2014, in the discount rate used to determine the benefit obligation. The
aforementioned decreases were partially offset by an increase in actuarial losses resulting from the decrease, in 2014, in the discount rate used to determine
the benefit obligation.
2014 v. 2013––The decrease in net periodic benefit costs for our postretirement plans was primarily driven by the decrease in the amounts amortized for
actuarial losses resulting from the increase, in 2013, in the discount rate used to determine the benefit obligation (which reduced the amount of deferred
actuarial losses).
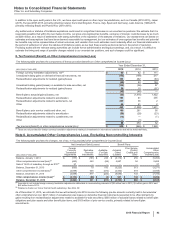
(e) For details of the changes in Other comprehensive income/(loss), see the benefit plan activity in the consolidated statements of comprehensive income.
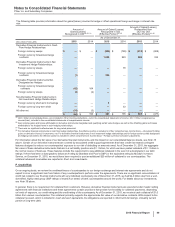
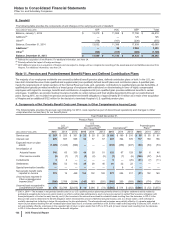
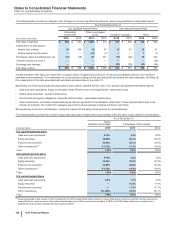
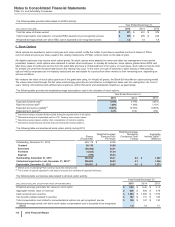
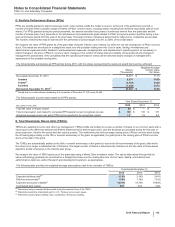
The following table provides the amounts in Accumulated other comprehensive loss expected to be amortized into 2016 net periodic benefit
costs:
Pension Plans
(MILLIONS OF DOLLARS)
U.S.
Qualified
U.S. Supplemental
(Non-Qualified) International Postretirement Plans
Actuarial losses $ (398)$ (37)$ (91)$ (29)
Prior service credits and other (5) 1 2 164
Total $ (403)$ (36)$ (89)$ 135