Pfizer 2015 Annual Report Download - page 131
Download and view the complete annual report
Please find page 131 of the 2015 Pfizer annual report below. You can navigate through the pages in the report by either clicking on the pages listed below, or by using the keyword search tool below to find specific information within the annual report.-
 1
1 -
2
-
3
-
4
-
5
-
6
-
7
-
8
-
9
-
10
-
11
-
12
-
13
-
14
-
15
-
16
-
17
-
18
-
19
-
20
-
21
-
22
-
23
-
24
-
25
-
26
-
27
-
28
-
29
-
30
-
31
-
32
-
33
-
34
-
35
-
36
-
37
-
38
-
39
-
40
-
41
-
42
-
43
-
44
-
45
-
46
-
47
-
48
-
49
-
50
-
51
-
52
-
53
-
54
-
55
-
56
-
57
-
58
-
59
-
60
-
61
-
62
-
63
-
64
-
65
-
66
-
67
-
68
-
69
-
70
-
71
-
72
-
73
-
74
-
75
-
76
-
77
-
78
-
79
-
80
-
81
-
82
-
83
-
84
-
85
-
86
-
87
-
88
-
89
-
90
-
91
-
92
-
93
-
94
-
95
-
96
-
97
-
98
-
99
-
100
-
101
-
102
-
103
-
104
-
105
-
106
-
107
-
108
-
109
-
110
-
111
-
112
-
113
-
114
-
115
-
116
-
117
-
118
-
119
-
120
-
 121
121 -
 122
122 -
 123
123 -
 124
124 -
 125
125 -
 126
126 -
 127
127 -
 128
128 -
 129
129 -
 130
130 -
 131
131 -
 132
132 -
 133
133 -
 134
134
 |
 |

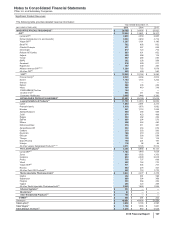
Quarterly Consolidated Financial Data (Unaudited)
Pfizer Inc. and Subsidiary Companies
130
2015 Financial Report
Quarter
(MILLIONS OF DOLLARS, EXCEPT PER COMMON SHARE DATA) First Second Third(a) Fourth(b)
2015
Revenues $10,864 $11,853 $12,087 $14,047
Costs and expenses(c) 7,722 8,228 8,808 13,976
Restructuring charges and certain acquisition-related costs(d), (e) 60 86 581 425
Income/(loss) from continuing operations before provision for taxes on income 3,082 3,539 2,697 (354)
Provision/(benefit) for taxes on income 706 905 567 (188)
Income/(loss) from continuing operations 2,376 2,635 2,130 (166)
Discontinued operations—net of tax 518(3)
Net income/(loss) before allocation to noncontrolling interests 2,381 2,635 2,139 (169)
Less: Net income attributable to noncontrolling interests 6993
Net income/(loss) attributable to Pfizer Inc. $2,376 $2,626 $2,130 $(172)
Earnings/(loss) per common share—basic:
Income/(loss) from continuing operations attributable to Pfizer Inc. common
shareholders $0.38 $0.43 $0.34 $(0.03)
Discontinued operations—net of tax ————
Net income/(loss) attributable to Pfizer Inc. common shareholders $0.38 $0.43 $0.35 $(0.03)
Earnings/(loss) per common share—diluted:
Income/(loss) from continuing operations attributable to Pfizer Inc. common
shareholders $0.38 $0.42 $0.34 $(0.03)
Discontinued operations—net of tax ————
Net income/(loss) attributable to Pfizer Inc. common shareholders $0.38 $0.42 $0.34 $(0.03)
Cash dividends paid per common share $0.28 $0.28 $0.28 $0.28
Stock prices
High $35.45 $35.53 $36.46 $36.07
Low $31.01 $33.21 $28.47 $30.64
(a) In accordance with our domestic and international reporting periods, our consolidated statement of income for the third quarter of 2015 reflects one month of
legacy Hospira U.S. operations but do not include any financial results from legacy Hospira international operations.
(b) In accordance with our domestic and international reporting periods, our consolidated statement of income for the fourth quarter of 2015 reflects three months of
legacy Hospira global operations.
(c) The fourth quarter of 2015 historically reflects higher costs in Cost of sales, Selling, informational and administrative expenses and Research and development
expenses. The fourth quarter of 2015 includes (i) charges of $878 million related to Venezuela resulting from foreign currency loss ($806 million) and an
inventory impairment charge ($72 million); (ii) a charge of $784.6 million for an agreement in principle to settle claims relating to Protonix; (iii) charges of $491
million related to pension settlements; (iv) a benefit of $306 million resulting from a change in the profit deferred in inventory relating to inventory that had not
been sold to third parties; and (v) a charge of $245 million related to the write-down of assets to net realizable value, which is primarily recorded in Other
(income)/deductions––net.
(d) The third quarter of 2015 reflects (i) restructuring charges of $469 million for employee termination costs, asset impairments and other exit costs largely
associated with our acquisition of Hospira; (ii) transaction costs, such as banking, legal, accounting and other similar services, directly related to our acquisition
of Hospira of $64 million; and (iii) integration costs, representing external, incremental costs directly related to integrating acquired businesses, and primarily
include expenditures for consulting and the integration of systems and processes of $48 million, largely related to our acquisition of Hospira.
(e) The fourth quarter of 2015 reflects (i) restructuring charges of $256 million for employee termination costs, asset impairments and other exit costs, which are
largely associated with our acquisition of Hospira; (ii) transaction costs, such as banking, legal, accounting and other similar services, directly related to our
pending combination with Allergan plc (Allergan) and our acquisition of Hospira of $52 million; and (iii) integration costs, representing external, incremental costs
directly related to integrating acquired businesses, and primarily include expenditures for consulting and the integration of systems and processes, of $116
million, primarily related to our acquisition of Hospira.
Basic and diluted EPS are computed independently for each of the periods presented. Accordingly, the sum of the quarterly EPS amounts may
not agree to the total for the year.