Pfizer 2015 Annual Report Download - page 67
Download and view the complete annual report
Please find page 67 of the 2015 Pfizer annual report below. You can navigate through the pages in the report by either clicking on the pages listed below, or by using the keyword search tool below to find specific information within the annual report.-
 1
1 -
2
-
3
-
4
-
5
-
6
-
7
-
8
-
9
-
10
-
11
-
12
-
13
-
14
-
15
-
16
-
17
-
18
-
19
-
20
-
21
-
22
-
23
-
24
-
25
-
26
-
27
-
28
-
29
-
30
-
31
-
32
-
33
-
34
-
35
-
36
-
37
-
38
-
39
-
40
-
41
-
42
-
43
-
44
-
45
-
46
-
47
-
48
-
49
-
50
-
51
-
52
-
53
-
54
-
55
-
56
-
 57
57 -
 58
58 -
 59
59 -
 60
60 -
 61
61 -
 62
62 -
 63
63 -
 64
64 -
 65
65 -
 66
66 -
 67
67 -
 68
68 -
 69
69 -
 70
70 -
 71
71 -
 72
72 -
 73
73 -
 74
74 -
 75
75 -
 76
76 -
 77
77 -
78
-
79
-
80
-
81
-
82
-
83
-
84
-
85
-
86
-
87
-
88
-
89
-
90
-
91
-
92
-
93
-
94
-
95
-
96
-
97
-
98
-
99
-
100
-
101
-
102
-
103
-
104
-
105
-
106
-
107
-
108
-
109
-
110
-
111
-
112
-
113
-
114
-
115
-
116
-
117
-
118
-
119
-
120
-
121
-
122
-
123
-
124
-
125
-
126
-
127
-
128
-
129
-
130
-
131
-
132
-
133
-
134
 |
 |

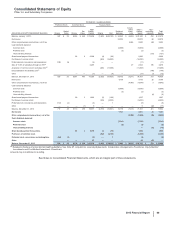
Consolidated Statements of Income
Pfizer Inc. and Subsidiary Companies
66
2015 Financial Report
Year Ended December 31,
(MILLIONS, EXCEPT PER COMMON SHARE DATA) 2015 2014 2013
Revenues $48,851 $49,605 $51,584
Costs and expenses:
Cost of sales(a) 9,648 9,577 9,586
Selling, informational and administrative expenses(a) 14,809 14,097 14,355
Research and development expenses(a) 7,690 8,393 6,678
Amortization of intangible assets 3,728 4,039 4,599
Restructuring charges and certain acquisition-related costs 1,152 250 1,182
Other (income)/deductions––net 2,860 1,009 (532)
Income from continuing operations before provision for taxes on income 8,965 12,240 15,716
Provision for taxes on income 1,990 3,120 4,306
Income from continuing operations 6,975 9,119 11,410
Discontinued operations:
Income from discontinued operations––net of tax 17 (6) 308
Gain/(loss) on disposal of discontinued operations––net of tax (6) 55 10,354
Discontinued operations––net of tax 11 48 10,662
Net income before allocation to noncontrolling interests 6,986 9,168 22,072
Less: Net income attributable to noncontrolling interests 26 32 69
Net income attributable to Pfizer Inc. $6,960 $9,135 $22,003
Earnings per common share––basic:
Income from continuing operations attributable to Pfizer Inc. common shareholders $1.13 $1.43 $1.67
Discontinued operations––net of tax —0.01 1.56
Net income attributable to Pfizer Inc. common shareholders $1.13 $1.44 $3.23
Earnings per common share––diluted:
Income from continuing operations attributable to Pfizer Inc. common shareholders $1.11 $1.41 $1.65
Discontinued operations––net of tax —0.01 1.54
Net income attributable to Pfizer Inc. common shareholders $1.11 $1.42 $3.19
Weighted-average shares––basic 6,176 6,346 6,813
Weighted-average shares––diluted 6,257 6,424 6,895
Cash dividends paid per common share $1.12 $1.04 $0.96
(a) Exclusive of amortization of intangible assets, except as disclosed in Note 1K. Basis of Presentation and Significant Accounting Policies: Amortization of
Intangible Assets, Depreciation and Certain Long-Lived Assets.
Amounts may not add due to rounding.
See Notes to Consolidated Financial Statements, which are an integral part of these statements.