Pfizer 2015 Annual Report Download - page 43
Download and view the complete annual report
Please find page 43 of the 2015 Pfizer annual report below. You can navigate through the pages in the report by either clicking on the pages listed below, or by using the keyword search tool below to find specific information within the annual report.-
 1
1 -
2
-
3
-
4
-
5
-
6
-
7
-
8
-
9
-
10
-
11
-
12
-
13
-
14
-
15
-
16
-
17
-
18
-
19
-
20
-
21
-
22
-
23
-
24
-
25
-
26
-
27
-
28
-
29
-
30
-
31
-
32
-
 33
33 -
 34
34 -
 35
35 -
 36
36 -
 37
37 -
 38
38 -
 39
39 -
 40
40 -
 41
41 -
 42
42 -
 43
43 -
 44
44 -
 45
45 -
 46
46 -
 47
47 -
 48
48 -
 49
49 -
 50
50 -
 51
51 -
 52
52 -
 53
53 -
54
-
55
-
56
-
57
-
58
-
59
-
60
-
61
-
62
-
63
-
64
-
65
-
66
-
67
-
68
-
69
-
70
-
71
-
72
-
73
-
74
-
75
-
76
-
77
-
78
-
79
-
80
-
81
-
82
-
83
-
84
-
85
-
86
-
87
-
88
-
89
-
90
-
91
-
92
-
93
-
94
-
95
-
96
-
97
-
98
-
99
-
100
-
101
-
102
-
103
-
104
-
105
-
106
-
107
-
108
-
109
-
110
-
111
-
112
-
113
-
114
-
115
-
116
-
117
-
118
-
119
-
120
-
121
-
122
-
123
-
124
-
125
-
126
-
127
-
128
-
129
-
130
-
131
-
132
-
133
-
134
 |
 |

Financial Review
Pfizer Inc. and Subsidiary Companies
42
2015 Financial Report
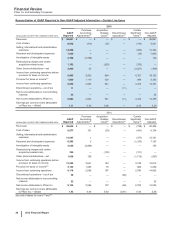
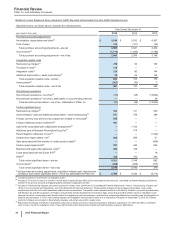
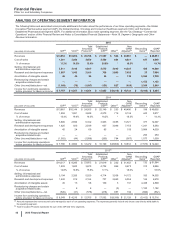
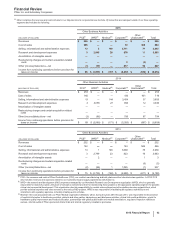
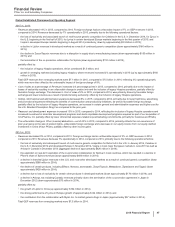
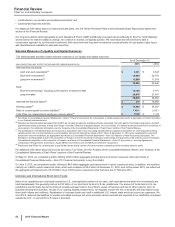
ANALYSIS OF OPERATING SEGMENT INFORMATION
The following tables and associated notes provide additional information about the performance of our three operating segments—the Global
Innovative Pharmaceutical segment (GIP); the Global Vaccines, Oncology and Consumer Healthcare segment (VOC); and the Global
Established Pharmaceutical segment (GEP). For additional information about each operating segment, see the “Our Strategy––Commercial
Operations” section of this Financial Review and Notes to Consolidated Financial Statements—Note 18. Segment, Geographic and Other
Revenue Information.
2015
(MILLIONS OF DOLLARS) GIP(a) VOC(a)
Total
Innovative
Products(b)
Established
Products
GEP(a) Other(c)
Non-
GAAP
Adjusted(d) Reconciling
Items(e) GAAP
Reported
Revenues $13,954 $12,803 $ 26,758 $ 21,587 $ 506 $ 48,851 $ — $ 48,851
Cost of sales 1,561 2,089 3,650 4,486 884 9,021 627 9,648
% of revenue 11.2% 16.3% 13.6%20.8%*
18.5%*
19.7%
Selling, informational and
administrative expenses 3,611 3,195 6,807 3,572 3,945 14,324 485 14,809
Research and development expenses 1,987 1,043 3,030 758 3,865 7,653 37 7,690
Amortization of intangible assets 46 48 94 36 — 130 3,598 3,728
Restructuring charges and certain
acquisition-related costs —— — —— — 1,152 1,152
Other (income)/deductions––net (1,008) (79) (1,087)(150) 827 (409)3,269 2,860
Income from continuing operations
before provision for taxes on income $ 7,757 $ 6,507 $ 14,264 $ 12,885 $(9,016) $ 18,133 $ (9,168)$8,965
2014
(MILLIONS OF DOLLARS) GIP(a) VOC(a)
Total
Innovative
Products(b)
Established
Products
GEP(a) Other(c)
Non-
GAAP
Adjusted(d) Reconciling
Items(e) GAAP
Reported
Revenues $13,861 $10,144 $ 24,005 $ 25,149 $ 253 $ 49,406 $ 198 $49,605
Cost of sales 1,858 1,991 3,848 4,570 716 9,134 443 9,577
% of revenue 13.4% 19.6% 16.0%18.2%*
18.5%*
19.3%
Selling, informational and
administrative expenses 3,606 2,556 6,162 3,903 3,655 13,721 377 14,097
Research and development expenses 1,625 925 2,549 657 3,946 7,153 1,241 8,393
Amortization of intangible assets 45 24 69 85 — 155 3,884 4,039
Restructuring charges and certain
acquisition-related costs —— — —— — 250 250
Other (income)/deductions––net (1,052) (44) (1,096)(265) 794 (567)1,577 1,009
Income from continuing operations
before provision for taxes on income $ 7,780 $ 4,692 $ 12,472 $ 16,199 $(8,859) $ 19,812 $ (7,573)$
12,240
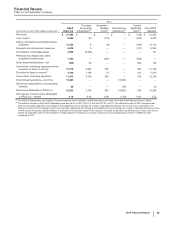
2013(f)
(MILLIONS OF DOLLARS) GIP(a) VOC(a)
Total
Innovative
Products(b)
Established
Products
GEP(a) Other(c)
Non-
GAAP
Adjusted(d) Reconciling
Items(e) GAAP
Reported
Revenues $14,317 $ 9,285 $ 23,602 $ 27,619 $ 232 $ 51,452 $ 132 $51,584
Cost of sales 1,833 1,843 3,675 4,732 866 9,273 313 9,586
% of revenue 12.8% 19.8% 15.6%17.1%*
18.0%*
18.6%
Selling, informational and
administrative expenses 3,194 2,326 5,520 4,714 3,938 14,172 183 14,355
Research and development expenses 1,242 912 2,154 737 3,663 6,554 124 6,678
Amortization of intangible assets 45 13 58 100 3161 4,438 4,599
Restructuring charges and certain
acquisition-related costs —6 6 —(5)—
1,182 1,182
Other (income)/deductions––net (545) (31) (576)(216) 957 164 (696)(532)
Income from continuing operations
before provision for taxes on income $ 8,549 $ 4,216 $ 12,765 $ 17,552 $(9,189) $ 21,128 $ (5,412)$
15,716
(a) Amounts represent the revenues and costs managed by each of our operating segments. The expenses generally include only those costs directly attributable to
the operating segment.
(b) Total Innovative Products represents the sum of the GIP and VOC segments.