Pfizer 2015 Annual Report Download - page 52
Download and view the complete annual report
Please find page 52 of the 2015 Pfizer annual report below. You can navigate through the pages in the report by either clicking on the pages listed below, or by using the keyword search tool below to find specific information within the annual report.-
 1
1 -
2
-
3
-
4
-
5
-
6
-
7
-
8
-
9
-
10
-
11
-
12
-
13
-
14
-
15
-
16
-
17
-
18
-
19
-
20
-
21
-
22
-
23
-
24
-
25
-
26
-
27
-
28
-
29
-
30
-
31
-
32
-
33
-
34
-
35
-
36
-
37
-
38
-
39
-
40
-
41
-
 42
42 -
 43
43 -
 44
44 -
 45
45 -
 46
46 -
 47
47 -
 48
48 -
 49
49 -
 50
50 -
 51
51 -
 52
52 -
 53
53 -
 54
54 -
 55
55 -
 56
56 -
 57
57 -
 58
58 -
 59
59 -
 60
60 -
 61
61 -
 62
62 -
63
-
64
-
65
-
66
-
67
-
68
-
69
-
70
-
71
-
72
-
73
-
74
-
75
-
76
-
77
-
78
-
79
-
80
-
81
-
82
-
83
-
84
-
85
-
86
-
87
-
88
-
89
-
90
-
91
-
92
-
93
-
94
-
95
-
96
-
97
-
98
-
99
-
100
-
101
-
102
-
103
-
104
-
105
-
106
-
107
-
108
-
109
-
110
-
111
-
112
-
113
-
114
-
115
-
116
-
117
-
118
-
119
-
120
-
121
-
122
-
123
-
124
-
125
-
126
-
127
-
128
-
129
-
130
-
131
-
132
-
133
-
134
 |
 |

Financial Review
Pfizer Inc. and Subsidiary Companies
2015 Financial Report
51
2014 v. 2013
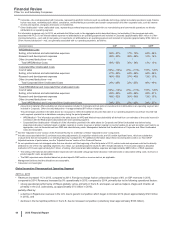
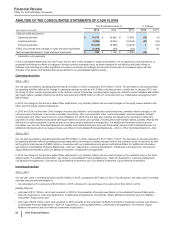
Our net cash used in investing activities was $5.7 billion in 2014, compared to $10.5 billion in 2013. The decrease in net cash used in
investing activities was primarily attributable to:
• net purchases of investments of $4.2 billion in 2014, compared to $9.4 billion in 2013,
partially offset by:
• cash paid of $195 million, net of cash acquired, for the acquisition of InnoPharma in 2014.
Financing Activities
2015 v. 2014
Our net cash used in financing activities was $10.2 billion in 2015, compared to $10.0 billion in 2014. The increase in net cash used in
financing activities was primarily attributable to:
• net principal payments on long-term debt of $3.0 billion in 2015, compared to net proceeds from issuance of long-term debt of $2.4 billion in
2014; and
• purchases of common stock of $6.2 billion in 2015, compared to $5.0 billion in 2014,
partially offset by:
• net proceeds from short-term borrowings of $4.3 billion in 2015, compared to net payments on short-term borrowings of $1.8 billion in 2014.
2014 v. 2013
Our net cash used in financing activities was $10.0 billion in 2014, compared to $15.0 billion in 2013. The decrease in net cash used in
financing activities was primarily attributable to:
• purchases of common stock of $5.0 billion in 2014, compared to $16.3 billion in 2013,
partially offset by:
• net proceeds from borrowings of $548 million in 2014, compared to net proceeds from borrowings of $6.0 billion in 2013; and
• proceeds from the exercise of stock options of $1.0 billion in 2014, compared to $1.8 billion in 2013.
Supplemental Schedule of Non-Cash Investing and Financing Information
In 2015, we exchanged $1.7 billion debt of our recently acquired subsidiary Hospira for virtually the same amount of Pfizer Inc. debt.
In 2013, we had the following non-cash transactions:
• we sold Zoetis common stock for Pfizer common stock valued at $11.4 billion;
• we exchanged Zoetis common stock for the retirement of Pfizer commercial paper issued in 2013 for $2.5 billion;
• we exchanged Zoetis senior notes for the retirement of Pfizer commercial paper issued in 2012 for $1.0 billion;
• we transferred certain product rights, valued at $1.2 billion, to an equity-method investment (Hisun Pfizer); and
• we contributed an investment, valued at $447 million, in connection with the resolution of a legal matter (Quigley).
For further details on the 2015 debt exchange, see Notes to Consolidated Financial Statements—Note 7D. Financial Instruments: Long-Term
Debt. Zoetis is our former Animal Health business. For further details on Zoetis-related transactions, see Notes to Consolidated Financial
Statements—Note 2D. Acquisitions, Licensing Agreements, Collaborative Arrangements, Divestitures, Equity-Method Investments and Cost-
Method Investment: Divestitures. For further details on the transfer of certain product rights, see Notes to Consolidated Financial Statements
—Note 2E. Acquisitions, Licensing Agreements, Collaborative Arrangements, Divestitures, Equity-Method Investments and Cost-Method
Investment: Equity-Method Investments.
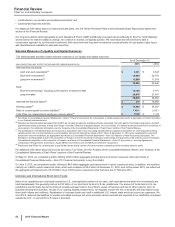
ANALYSIS OF FINANCIAL CONDITION, LIQUIDITY AND CAPITAL RESOURCES
We rely largely on operating cash flows, short-term investments, short-term commercial paper borrowings and long-term debt to provide for our
liquidity requirements. Due to our significant operating cash flows as well as our financial assets, access to capital markets and available lines
of credit and revolving credit agreements, we believe that we have, and will maintain, the ability to meet our liquidity needs for the foreseeable
future, which include:
• the working capital requirements of our operations, including our research and development activities;
• investments in our business;
• dividend payments and potential increases in the dividend rate;
• share repurchases;
• the cash requirements associated with our cost-reduction/productivity initiatives;
• paying down outstanding debt;