Pfizer 2015 Annual Report Download - page 101
Download and view the complete annual report
Please find page 101 of the 2015 Pfizer annual report below. You can navigate through the pages in the report by either clicking on the pages listed below, or by using the keyword search tool below to find specific information within the annual report.-
 1
1 -
2
-
3
-
4
-
5
-
6
-
7
-
8
-
9
-
10
-
11
-
12
-
13
-
14
-
15
-
16
-
17
-
18
-
19
-
20
-
21
-
22
-
23
-
24
-
25
-
26
-
27
-
28
-
29
-
30
-
31
-
32
-
33
-
34
-
35
-
36
-
37
-
38
-
39
-
40
-
41
-
42
-
43
-
44
-
45
-
46
-
47
-
48
-
49
-
50
-
51
-
52
-
53
-
54
-
55
-
56
-
57
-
58
-
59
-
60
-
61
-
62
-
63
-
64
-
65
-
66
-
67
-
68
-
69
-
70
-
71
-
72
-
73
-
74
-
75
-
76
-
77
-
78
-
79
-
80
-
81
-
82
-
83
-
84
-
85
-
86
-
87
-
88
-
89
-
90
-
 91
91 -
 92
92 -
 93
93 -
 94
94 -
 95
95 -
 96
96 -
 97
97 -
 98
98 -
 99
99 -
 100
100 -
 101
101 -
 102
102 -
 103
103 -
 104
104 -
 105
105 -
 106
106 -
 107
107 -
 108
108 -
 109
109 -
 110
110 -
 111
111 -
112
-
113
-
114
-
115
-
116
-
117
-
118
-
119
-
120
-
121
-
122
-
123
-
124
-
125
-
126
-
127
-
128
-
129
-
130
-
131
-
132
-
133
-
134
 |
 |

Notes to Consolidated Financial Statements
Pfizer Inc. and Subsidiary Companies
100
2015 Financial Report
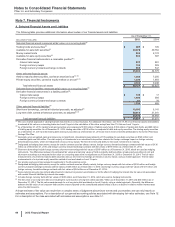
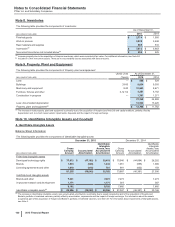
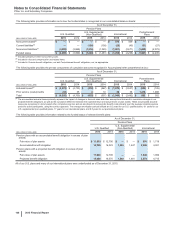
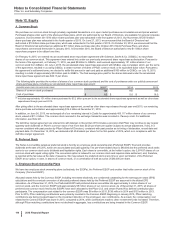
Note 8. Inventories
The following table provides the components of Inventories:
As of December 31,
(MILLIONS OF DOLLARS) 2015 2014
Finished goods $2,714 $1,905
Work in process 3,932 3,248
Raw materials and supplies 867 510
Inventories(a) $7,513 $5,663
Noncurrent inventories not included above(b) $594 $425
(a) Increase primarily due to the acquisition of Hospira inventories, which were recorded at fair value. For additional information, see Note 2A.
(b) Included in Other noncurrent assets. There are no recoverability issues associated with these amounts.
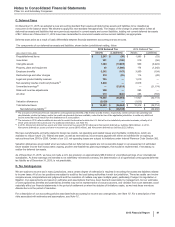
Note 9. Property, Plant and Equipment
The following table provides the components of Property, plant and equipment:
Useful Lives As of December 31,
(MILLIONS OF DOLLARS) (Years) 2015 2014
Land —$588 $529
Buildings 33-50 9,604 9,355
Machinery and equipment 8-20 10,933 9,671
Furniture, fixtures and other 3-12 1/2 4,351 4,162
Construction in progress —1,791 1,271
27,268 24,988
Less: Accumulated depreciation 13,502 13,226
Property, plant and equipment(a) $13,766 $11,762
(a) The increase in total property, plant and equipment is primarily due to the acquisition of Hospira (see Note 2A) and capital additions, partially offset by
depreciation and, to a much lesser extent, impairments, disposals and the impact of foreign exchange.
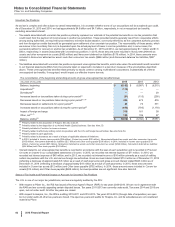
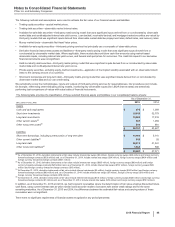
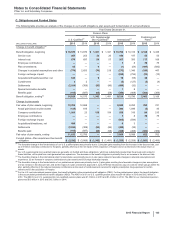
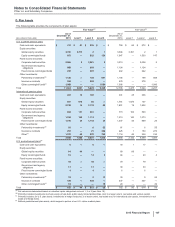
Note 10. Identifiable Intangible Assets and Goodwill
A. Identifiable Intangible Assets
Balance Sheet Information
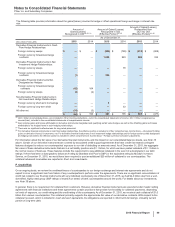
The following table provides the components of Identifiable intangible assets:
December 31, 2015 December 31, 2014
(MILLIONS OF DOLLARS)
Gross
Carrying
Amount Accumulated
Amortization
Identifiable
Intangible
Assets, less
Accumulated
Amortization
Gross
Carrying
Amount
Accumulated
Amortization
Identifiable
Intangible
Assets, less
Accumulated
Amortization
Finite-lived intangible assets
Developed technology rights $ 77,613 $ (47,193)$ 30,419 $70,946 $ (44,694) $ 26,252
Brands 1,973 (928)1,044 1,951 (855)1,096
Licensing agreements and other 1,619 (918)701 991 (832)159
81,205 (49,040)32,165 73,887 (46,381) 27,506
Indefinite-lived intangible assets
Brands and other 7,021 7,021 7,273 7,273
In-process research and development 1,171 1,171 387 387
8,192 8,192 7,660 7,660
Identifiable intangible assets(a) $ 89,396 $ (49,040)$ 40,356 $81,547 $ (46,381) $ 35,166
(a) The increase in Identifiable intangible assets, less accumulated amortization, is primarily due to assets acquired as part of the acquisition of Hospira and
Baxter’s portfolio of marketed vaccines, partially offset by amortization, impairments and the impact of foreign exchange. For information about the assets
acquired as part of the acquisition of Hospira and Baxter’s portfolio of marketed vaccines, see Note 2A. For information about impairments of intangible assets,
see Note 4.