Pfizer 2015 Annual Report Download - page 113
Download and view the complete annual report
Please find page 113 of the 2015 Pfizer annual report below. You can navigate through the pages in the report by either clicking on the pages listed below, or by using the keyword search tool below to find specific information within the annual report.-
 1
1 -
2
-
3
-
4
-
5
-
6
-
7
-
8
-
9
-
10
-
11
-
12
-
13
-
14
-
15
-
16
-
17
-
18
-
19
-
20
-
21
-
22
-
23
-
24
-
25
-
26
-
27
-
28
-
29
-
30
-
31
-
32
-
33
-
34
-
35
-
36
-
37
-
38
-
39
-
40
-
41
-
42
-
43
-
44
-
45
-
46
-
47
-
48
-
49
-
50
-
51
-
52
-
53
-
54
-
55
-
56
-
57
-
58
-
59
-
60
-
61
-
62
-
63
-
64
-
65
-
66
-
67
-
68
-
69
-
70
-
71
-
72
-
73
-
74
-
75
-
76
-
77
-
78
-
79
-
80
-
81
-
82
-
83
-
84
-
85
-
86
-
87
-
88
-
89
-
90
-
91
-
92
-
93
-
94
-
95
-
96
-
97
-
98
-
99
-
100
-
101
-
102
-
 103
103 -
 104
104 -
 105
105 -
 106
106 -
 107
107 -
 108
108 -
 109
109 -
 110
110 -
 111
111 -
 112
112 -
 113
113 -
 114
114 -
 115
115 -
 116
116 -
 117
117 -
 118
118 -
 119
119 -
 120
120 -
 121
121 -
 122
122 -
 123
123 -
124
-
125
-
126
-
127
-
128
-
129
-
130
-
131
-
132
-
133
-
134
 |
 |

Notes to Consolidated Financial Statements
Pfizer Inc. and Subsidiary Companies
112
2015 Financial Report
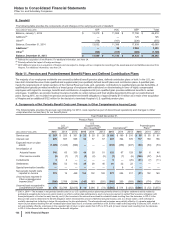
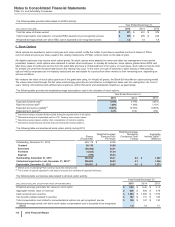
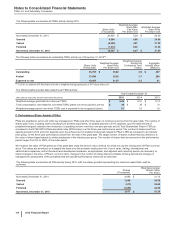
The following table provides data related to all RSU activity:
(MILLIONS OF DOLLARS)
Year Ended December 31,
2015 2014 2013
Total fair value of shares vested $371 $401 $379
Total compensation cost related to nonvested RSU awards not yet recognized, pre-tax $279 $255 $239
Weighted-average period over which RSU cost is expected to be recognized (years) 1.8 1.8 1.8
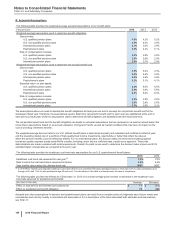
C. Stock Options
Stock options are awarded to select employees and, when vested, entitle the holder to purchase a specified number of shares of Pfizer
common stock at a price per share equal to the closing market price of Pfizer common stock on the date of grant.
All eligible employees may receive stock option grants. No stock options were awarded to senior and other key management in any period
presented; however, stock options were awarded to certain other employees. In virtually all instances, stock options granted since 2005 vest
after three years of continuous service from the grant date and have a contractual term of ten years. In most cases, stock options must be held
for at least one year from the grant date before any vesting may occur. In the event of a sale of business or plant closing or restructuring,
options held by employees are immediately vested and are exercisable for a period from three months to their remaining term, depending on
various conditions.
We measure the value of stock option grants as of the grant date using, for virtually all grants, the Black-Scholes-Merton option-pricing model.
The values determined through this fair value methodology generally are amortized on a straight-line basis over the vesting term into Cost of
sales, Selling, informational and administrative expenses, and/or Research and development expenses, as appropriate.
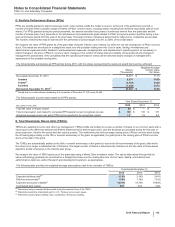
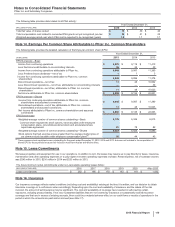
The following table provides the weighted-average assumptions used in the valuation of stock options:
Year Ended December 31,
2015 2014 2013
Expected dividend yield(a) 3.19%3.18%3.45%
Risk-free interest rate(b) 1.89%1.94%1.16%
Expected stock price volatility(c) 18.34%19.76%19.68%
Expected term (years)(d) 6.75 6.50 6.50
(a) Determined using a constant dividend yield during the expected term of the option.
(b) Determined using the interpolated yield on U.S. Treasury zero-coupon issues.
(c) Determined using implied volatility, after consideration of historical volatility.
(d) Determined using historical exercise and post-vesting termination patterns.
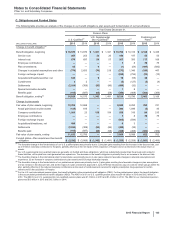
The following table summarizes all stock option activity during 2015:
Shares
(Thousands)
Weighted-Average
Exercise Price
Per Share
Weighted-Average
Remaining
Contractual Term
(Years)
Aggregate
Intrinsic Value(a)
(Millions)
Outstanding, December 31, 2014 249,112 $24.05
Granted 46,130 34.59
Exercised (56,890)22.31
Forfeited (4,825)31.24
Expired (973)26.24
Outstanding, December 31, 2015 232,554 26.41 6.2 $ 1,467
Vested and expected to vest, December 31, 2015(b) 226,804 26.23 6.1 1,466
Exercisable, December 31, 2015 109,561 $20.67 4.0 $ 1,273
(a) Market price of underlying Pfizer common stock less exercise price.
(b) The number of options expected to vest takes into account an estimate of expected forfeitures.
The following table summarizes data related to all stock option activity:
Year Ended December 31,
(MILLIONS OF DOLLARS, EXCEPT PER STOCK OPTION AMOUNTS) 2015 2014 2013
Weighted-average grant-date fair value per stock option $4.30 $4.40 $3.13
Aggregate intrinsic value on exercise $666 $458 $578
Cash received upon exercise $1,263 $1,002 $1,750
Tax benefits realized related to exercise $187 $131 $160
Total compensation cost related to nonvested stock options not yet recognized, pre-tax $159 $147 $120
Weighted-average period over which stock option compensation cost is expected to be recognized
(years) 1.8 1.8 1.7