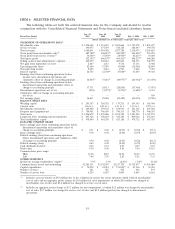
Pep Boys 2010 Annual Report Download - page 87
Download and view the complete annual report
Please find page 87 of the 2010 Pep Boys annual report below. You can navigate through the pages in the report by either clicking on the pages listed below, or by using the keyword search tool below to find specific information within the annual report.-
 1
1 -
2
-
3
-
4
-
5
-
6
-
7
-
8
-
9
-
10
-
11
-
12
-
13
-
14
-
15
-
16
-
17
-
18
-
19
-
20
-
21
-
22
-
23
-
24
-
25
-
26
-
27
-
28
-
29
-
30
-
31
-
32
-
33
-
34
-
35
-
36
-
37
-
38
-
39
-
40
-
41
-
42
-
43
-
44
-
45
-
46
-
47
-
48
-
49
-
50
-
51
-
52
-
53
-
54
-
55
-
56
-
57
-
58
-
59
-
60
-
61
-
62
-
63
-
64
-
65
-
66
-
67
-
68
-
69
-
70
-
71
-
72
-
73
-
74
-
75
-
76
-
 77
77 -
 78
78 -
 79
79 -
 80
80 -
 81
81 -
 82
82 -
 83
83 -
 84
84 -
 85
85 -
 86
86 -
 87
87 -
 88
88 -
 89
89 -
 90
90 -
 91
91 -
 92
92 -
 93
93 -
 94
94 -
 95
95 -
 96
96 -
 97
97 -
98
-
99
-
100
-
101
-
102
-
103
-
104
-
105
-
106
-
107
-
108
-
109
-
110
-
111
-
112
-
113
-
114
-
115
-
116
-
117
-
118
-
119
-
120
-
121
-
122
-
123
-
124
-
125
-
126
-
127
-
128
-
129
-
130
-
131
-
132
-
133
-
134
-
135
-
136
-
137
-
138
-
139
-
140
-
141
-
142
-
143
-
144
-
145
-
146
-
147
-
148
-
149
-
150
-
151
-
152
-
153
-
154
-
155
-
156
-
157
-
158
-
159
-
160
 |
 |
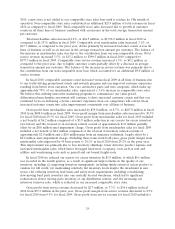
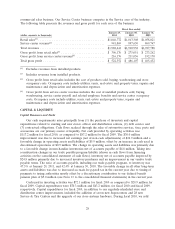
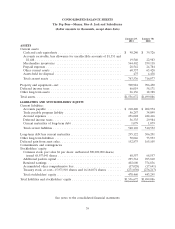
seven properties classified as held for disposal for net proceeds of $4.3 million, of which $0.6 million is
included in discontinued operations, completed one sale leaseback transaction for net proceeds of
$1.6 million and received $2.1 million in net settlement proceeds from the disposition of a previously
closed property. During fiscal 2009, we sold four properties classified as held for disposal for net
proceeds of $3.6 million, of which $1.8 million is reported in discontinued operations, and completed
four leaseback transactions for net proceeds of $12.9 million. During fiscal 2009, we acquired
substantially all of the assets (other than real property) of Florida Tire, Inc. for $2.7 million. In
connection with the acquisition, we recorded a contingent liability of $1.7 million, of which $0.3 million
was paid in fiscal 2010. During fiscal 2010, we used $9.6 million as collateral for retained liabilities
included within existing insurance programs in lieu of previously outstanding letters of credit. This
collateral is recorded within Other Long-Term Assets on the Consolidated Balance Sheet as of
January 29, 2011.
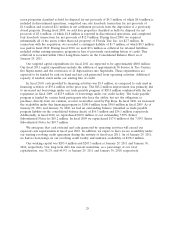
Our targeted capital expenditures for fiscal 2011 are expected to be approximately $80.0 million.
Our fiscal 2011 capital expenditures include the addition of approximately 50 Service & Tire Centers,
five Supercenters and the conversion of 24 Supercenters into Superhubs. These expenditures are
expected to be funded by cash on hand and net cash generated from operating activities. Additional
capacity, if needed, exists under our existing line of credit.
In fiscal 2010, cash provided by financing activities was $5.8 million, as compared to cash used in
financing activities of $39.4 million in the prior year. The $45.2 million improvement was primarily due
to increased net borrowings under our trade payable program of $20.0 million combined with the net
repayment, in fiscal 2009, of $23.9 million of borrowings under our credit facility. The trade payable
program is funded by various bank participants who have the ability, but not the obligation, to
purchase, directly from our vendors, account receivables owed by Pep Boys. In fiscal 2010, we increased
the availability under this financing program to $100.0 million from $50.0 million in fiscal 2009. As of
January 29, 2011 and January 30, 2010, we had an outstanding balance (classified as trade payable
program liability on the consolidated balance sheet) of $56.3 million and $34.1 million, respectively.
Additionally, in fiscal 2010, we repurchased $10.0 million of our outstanding 7.50% Senior
Subordinated Notes for $10.2 million. In fiscal 2009 we repurchased $17.0 million of the 7.50% Senior
Subordinated Notes for $10.7 million.
We anticipate that cash on hand and cash generated by operating activities will exceed our
expected cash requirements in fiscal year 2010. In addition, we expect to have excess availability under
our existing revolving credit agreement during the entirety of fiscal year 2011. As of January 29, 2011,
we had no borrowings on our revolving credit facility and undrawn availability of $138.2 million.
Our working capital was $203.4 million and $205.5 million at January 29, 2011 and January 30,
2010, respectively. Our long-term debt less current maturities, as a percentage of our total
capitalization, was 38.2% and 40.9% at January 29, 2011 and January 30, 2010, respectively.
29