Pep Boys 2010 Annual Report Download - page 85
Download and view the complete annual report
Please find page 85 of the 2010 Pep Boys annual report below. You can navigate through the pages in the report by either clicking on the pages listed below, or by using the keyword search tool below to find specific information within the annual report.-
 1
1 -
2
-
3
-
4
-
5
-
6
-
7
-
8
-
9
-
10
-
11
-
12
-
13
-
14
-
15
-
16
-
17
-
18
-
19
-
20
-
21
-
22
-
23
-
24
-
25
-
26
-
27
-
28
-
29
-
30
-
31
-
32
-
33
-
34
-
35
-
36
-
37
-
38
-
39
-
40
-
41
-
42
-
43
-
44
-
45
-
46
-
47
-
48
-
49
-
50
-
51
-
52
-
53
-
54
-
55
-
56
-
57
-
58
-
59
-
60
-
61
-
62
-
63
-
64
-
65
-
66
-
67
-
68
-
69
-
70
-
71
-
72
-
73
-
74
-
 75
75 -
 76
76 -
 77
77 -
 78
78 -
 79
79 -
 80
80 -
 81
81 -
 82
82 -
 83
83 -
 84
84 -
 85
85 -
 86
86 -
 87
87 -
 88
88 -
 89
89 -
 90
90 -
 91
91 -
 92
92 -
 93
93 -
 94
94 -
 95
95 -
96
-
97
-
98
-
99
-
100
-
101
-
102
-
103
-
104
-
105
-
106
-
107
-
108
-
109
-
110
-
111
-
112
-
113
-
114
-
115
-
116
-
117
-
118
-
119
-
120
-
121
-
122
-
123
-
124
-
125
-
126
-
127
-
128
-
129
-
130
-
131
-
132
-
133
-
134
-
135
-
136
-
137
-
138
-
139
-
140
-
141
-
142
-
143
-
144
-
145
-
146
-
147
-
148
-
149
-
150
-
151
-
152
-
153
-
154
-
155
-
156
-
157
-
158
-
159
-
160
 |
 |
Interest expense was $21.7 million in fiscal 2009, a decline of $5.3 million compared to the prior
year. Fiscal 2009 and 2008 included gains from the retirement of debt of $6.2 million and $3.5 million,
respectively. Fiscal 2008 also included a $1.2 million charge for deferred financing costs related to our
revolving credit facility that was replaced. Excluding these items, interest expense declined by
$1.4 million from fiscal 2008 to fiscal 2009 primarily due to reduced debt levels.
Income tax expense was $13.5 million, or an effective rate of 35.9%, for fiscal 2009 as compared to
an income tax benefit of $6.1 million, or an effective rate of 17.6%, for fiscal 2008. The current year
effective tax rate includes a benefit of $1.2 million due to the allocation of additional costs to certain
jurisdictions thereby reducing past and future tax liabilities. The prior year effective tax rate was
impacted by the non-deductibility of certain expenses for tax purposes, the recognition of gain for tax
on surrender of life insurance policies and the establishment of a valuation allowance on certain state
net operating losses and credits.
Loss from discontinued operations, net of tax, was $1.1 million in fiscal 2009 versus $1.6 million in
fiscal 2008. Fiscal 2009 and 2008 included, on a pre-tax basis, impairment charges of $0.2 million and
$1.9 million, respectively.
As a result of the foregoing, we reported net earnings of $23.0 million for fiscal 2009, an increase
of $53.5 million from our net loss of $30.4 million in fiscal 2008. Our basic and diluted earnings per
share were $0.44 for fiscal 2009 as compared to our basic and diluted loss per share of $0.58 in the
prior year.
Discontinued Operations
The analysis of our results of continuing operations excludes the operating results of closed stores,
where the customer base could not be maintained, which have been classified as discontinued
operations for all periods presented.
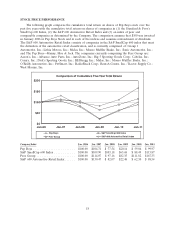
Industry Comparison
We operate in the U.S. automotive aftermarket, which has two general lines of business: (1) the
Service business, defined as Do-It-For-Me (service labor, installed merchandise and tires) and (2) the
Retail business, defined as Do-It-Yourself (retail merchandise) and commercial. Generally, specialized
automotive retailers focus on either the Service or Retail area of the business. We believe that
operation in both the Service and Retail areas positively differentiates us from most of our competitors.
Although we manage our performance at a store level in aggregation, we believe that the following
presentation, which includes the reclassification of revenue from merchandise that we install in
customer vehicles to service center revenue, shows an accurate comparison against competitors within
the two sales arenas. We compete in the Retail area of the business through our retail sales floor and
27