Pep Boys 2010 Annual Report Download - page 124
Download and view the complete annual report
Please find page 124 of the 2010 Pep Boys annual report below. You can navigate through the pages in the report by either clicking on the pages listed below, or by using the keyword search tool below to find specific information within the annual report.-
 1
1 -
2
-
3
-
4
-
5
-
6
-
7
-
8
-
9
-
10
-
11
-
12
-
13
-
14
-
15
-
16
-
17
-
18
-
19
-
20
-
21
-
22
-
23
-
24
-
25
-
26
-
27
-
28
-
29
-
30
-
31
-
32
-
33
-
34
-
35
-
36
-
37
-
38
-
39
-
40
-
41
-
42
-
43
-
44
-
45
-
46
-
47
-
48
-
49
-
50
-
51
-
52
-
53
-
54
-
55
-
56
-
57
-
58
-
59
-
60
-
61
-
62
-
63
-
64
-
65
-
66
-
67
-
68
-
69
-
70
-
71
-
72
-
73
-
74
-
75
-
76
-
77
-
78
-
79
-
80
-
81
-
82
-
83
-
84
-
85
-
86
-
87
-
88
-
89
-
90
-
91
-
92
-
93
-
94
-
95
-
96
-
97
-
98
-
99
-
100
-
101
-
102
-
103
-
104
-
105
-
106
-
107
-
108
-
109
-
110
-
111
-
112
-
113
-
 114
114 -
 115
115 -
 116
116 -
 117
117 -
 118
118 -
 119
119 -
 120
120 -
 121
121 -
 122
122 -
 123
123 -
 124
124 -
 125
125 -
 126
126 -
 127
127 -
 128
128 -
 129
129 -
 130
130 -
 131
131 -
 132
132 -
 133
133 -
 134
134 -
135
-
136
-
137
-
138
-
139
-
140
-
141
-
142
-
143
-
144
-
145
-
146
-
147
-
148
-
149
-
150
-
151
-
152
-
153
-
154
-
155
-
156
-
157
-
158
-
159
-
160
 |
 |

THE PEP BOYS—MANNY, MOE & JACK AND SUBSIDIARIES
NOTES TO CONSOLIDATED FINANCIAL STATEMENTS (Continued)
Years ended January 29, 2011, January 30, 2010 and January 31, 2009
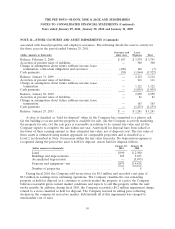
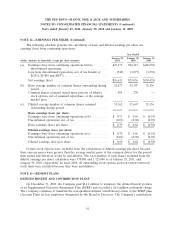
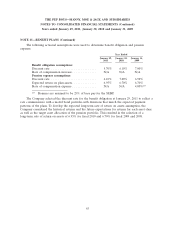
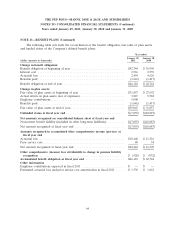
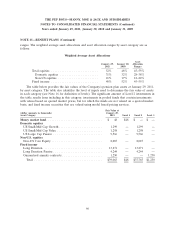
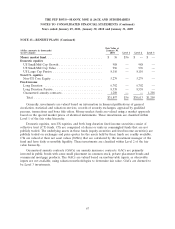
NOTE 13—BENEFIT PLANS (Continued)
ranges. The weighted average asset allocations and asset allocation ranges by asset category are as
follows:
Weighted Average Asset Allocations
Asset
January 29, January 30, Allocation
2011 2010 Ranges
Total equities ........................... 52% 48% 45–55%
Domestic equities ...................... 31% 32% 28–38%
Non-US equities ....................... 21% 17% 12–22%
Fixed income ........................... 48% 52% 45–55%
The table below provides the fair values of the Company’s pension plan assets at January 29, 2011,
by asset category. The table also identifies the level of inputs used to determine the fair value of assets
in each category (see Note 16 for definition of levels). The significant amount of Level 2 investments in
the table results from including in this category, investments in pooled funds that contain investments
with values based on quoted market prices, but for which the funds are not valued on a quoted market
basis, and fixed income securities that are valued using model based pricing services.
Fair Value at
(dollar amounts in thousands) January 29,
Asset Category 2011 Level 1 Level 2 Level 3
Money market fund ................................ $ 48 $48 $ — $ —
Domestic equities
US Small/Mid Cap Growth ......................... 1,299 — 1,299 —
US Small/Mid Cap Value .......................... 1,298 — 1,298 —
US Large Cap Passive ............................ 9,566 — 9,566 —
Non-U.S. equities
Non-US Core Equity ............................. 8,087 — 8,087 —
Fixed income
Long Duration ................................. 13,271 — 13,271 —
Long Duration Passive ............................ 4,244 — 4,244 —
Guaranteed annuity contracts ....................... 1,250 — — 1,250
Total ....................................... $39,063 $48 $37,765 $1,250
66