Pep Boys 2010 Annual Report Download - page 129
Download and view the complete annual report
Please find page 129 of the 2010 Pep Boys annual report below. You can navigate through the pages in the report by either clicking on the pages listed below, or by using the keyword search tool below to find specific information within the annual report.-
 1
1 -
2
-
3
-
4
-
5
-
6
-
7
-
8
-
9
-
10
-
11
-
12
-
13
-
14
-
15
-
16
-
17
-
18
-
19
-
20
-
21
-
22
-
23
-
24
-
25
-
26
-
27
-
28
-
29
-
30
-
31
-
32
-
33
-
34
-
35
-
36
-
37
-
38
-
39
-
40
-
41
-
42
-
43
-
44
-
45
-
46
-
47
-
48
-
49
-
50
-
51
-
52
-
53
-
54
-
55
-
56
-
57
-
58
-
59
-
60
-
61
-
62
-
63
-
64
-
65
-
66
-
67
-
68
-
69
-
70
-
71
-
72
-
73
-
74
-
75
-
76
-
77
-
78
-
79
-
80
-
81
-
82
-
83
-
84
-
85
-
86
-
87
-
88
-
89
-
90
-
91
-
92
-
93
-
94
-
95
-
96
-
97
-
98
-
99
-
100
-
101
-
102
-
103
-
104
-
105
-
106
-
107
-
108
-
109
-
110
-
111
-
112
-
113
-
114
-
115
-
116
-
117
-
118
-
 119
119 -
 120
120 -
 121
121 -
 122
122 -
 123
123 -
 124
124 -
 125
125 -
 126
126 -
 127
127 -
 128
128 -
 129
129 -
 130
130 -
 131
131 -
 132
132 -
 133
133 -
 134
134 -
 135
135 -
 136
136 -
 137
137 -
 138
138 -
 139
139 -
140
-
141
-
142
-
143
-
144
-
145
-
146
-
147
-
148
-
149
-
150
-
151
-
152
-
153
-
154
-
155
-
156
-
157
-
158
-
159
-
160
 |
 |

THE PEP BOYS—MANNY, MOE & JACK AND SUBSIDIARIES
NOTES TO CONSOLIDATED FINANCIAL STATEMENTS (Continued)
Years ended January 29, 2011, January 30, 2010 and January 31, 2009
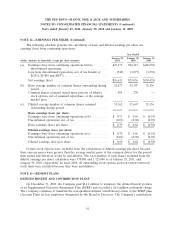
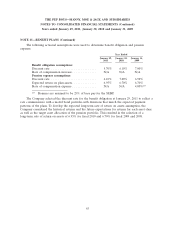
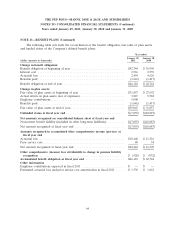
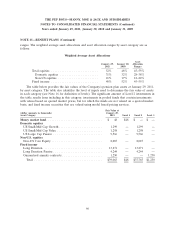
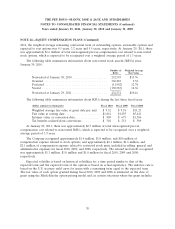
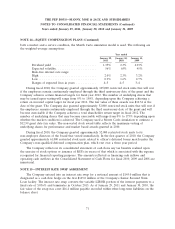
NOTE 14—EQUITY COMPENSATION PLANS (Continued)
both a market and a service condition, the Month Carlo simulation model is used. The following are
the weighted-average assumptions:
Year ended
January 29, January 30, January 31,
2011 2010 2009
Dividend yield ......................... 1.35% 2.3% 2.93%
Expected volatility ....................... 56% 65% 45%
Risk-free interest rate range:
High ................................ 2.0% 2.3% 3.2%
Low................................. 0.9% 1.6% 2.7%
Ranges of expected lives in years ............ 4–5 4–5 3–4
During fiscal 2010, the Company granted approximately 105,000 restricted stock units that will vest
if the employees remain continuously employed through the third anniversary date of the grant and the
Company achieves certain financial targets for fiscal year 2012. The number of underlying shares that
may be issued upon vesting will range from 0% to 150%, depending upon the Company achieving a
return on invested capital target for fiscal year 2012. The fair value of these awards was $10.34 at the
date of the grant. The Company also granted approximately 52,000 restricted stock units that will vest if
the employees remain continuously employed through the third anniversary date of the grant and will
become exercisable if the Company achieves a total shareholder return target in fiscal 2012. The
number of underlying shares that may become exercisable will range from 0% to 175% depending upon
whether the market condition is achieved. The Company used a Monte Carlo simulation to estimate a
$12.99 grant date fair value. The non-vested stock award table reflects the maximum vesting of
underlying shares for performance and market based awards granted in 2010.
During fiscal 2010, the Company granted approximately 52,000 restricted stock units to its
non-employee directors of the board that vested immediately. In the first quarter of 2010, the Company
granted approximately 61,000 restricted stock units related to officer’s deferred bonus match under the
Company’s non-qualified deferred compensation plan, which vest over a three year period.
The Company reflects in its consolidated statement of cash flows any tax benefits realized upon
the exercise of stock options or issuance of RSUs in excess of that which is associated with the expense
recognized for financial reporting purposes. The amounts reflected as financing cash inflows and
operating cash outflows in the Consolidated Statement of Cash Flows for fiscal 2010, 2009 and 2008 are
immaterial.
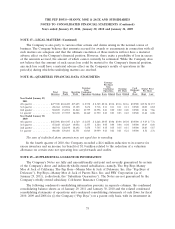
NOTE 15—INTEREST RATE SWAP AGREEMENT
The Company entered into an interest rate swap for a notional amount of $145.0 million that is
designated as a cash flow hedge on the first $145.0 million of the Company’s Senior Secured Term
Loan facility. The interest rate swap converts the variable LIBOR portion of the interest payments to a
fixed rate of 5.036% and terminates in October 2013. As of January 29, 2011 and January 30, 2010, the
fair value of the swap was a net $16.4 million payable recorded within other long-term liabilities on the
balance sheet.
71