Pep Boys 2010 Annual Report Download - page 136
Download and view the complete annual report
Please find page 136 of the 2010 Pep Boys annual report below. You can navigate through the pages in the report by either clicking on the pages listed below, or by using the keyword search tool below to find specific information within the annual report.-
 1
1 -
2
-
3
-
4
-
5
-
6
-
7
-
8
-
9
-
10
-
11
-
12
-
13
-
14
-
15
-
16
-
17
-
18
-
19
-
20
-
21
-
22
-
23
-
24
-
25
-
26
-
27
-
28
-
29
-
30
-
31
-
32
-
33
-
34
-
35
-
36
-
37
-
38
-
39
-
40
-
41
-
42
-
43
-
44
-
45
-
46
-
47
-
48
-
49
-
50
-
51
-
52
-
53
-
54
-
55
-
56
-
57
-
58
-
59
-
60
-
61
-
62
-
63
-
64
-
65
-
66
-
67
-
68
-
69
-
70
-
71
-
72
-
73
-
74
-
75
-
76
-
77
-
78
-
79
-
80
-
81
-
82
-
83
-
84
-
85
-
86
-
87
-
88
-
89
-
90
-
91
-
92
-
93
-
94
-
95
-
96
-
97
-
98
-
99
-
100
-
101
-
102
-
103
-
104
-
105
-
106
-
107
-
108
-
109
-
110
-
111
-
112
-
113
-
114
-
115
-
116
-
117
-
118
-
119
-
120
-
121
-
122
-
123
-
124
-
125
-
 126
126 -
 127
127 -
 128
128 -
 129
129 -
 130
130 -
 131
131 -
 132
132 -
 133
133 -
 134
134 -
 135
135 -
 136
136 -
 137
137 -
 138
138 -
 139
139 -
 140
140 -
 141
141 -
 142
142 -
 143
143 -
 144
144 -
 145
145 -
 146
146 -
147
-
148
-
149
-
150
-
151
-
152
-
153
-
154
-
155
-
156
-
157
-
158
-
159
-
160
 |
 |

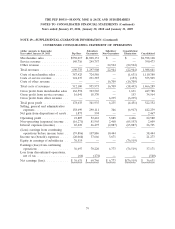
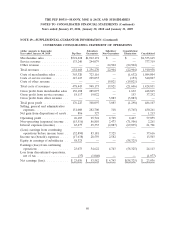
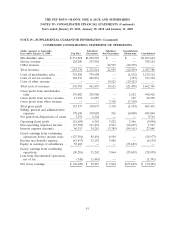
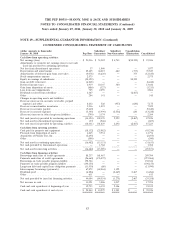
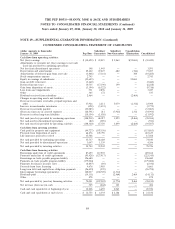
THE PEP BOYS—MANNY, MOE & JACK AND SUBSIDIARIES
NOTES TO CONSOLIDATED FINANCIAL STATEMENTS (Continued)
Years ended January 29, 2011, January 30, 2010 and January 31, 2009
NOTE 19—SUPPLEMENTAL GUARANTOR INFORMATION (Continued)
CONDENSED CONSOLIDATING BALANCE SHEET
(dollar amounts in thousands) Subsidiary Subsidiary Consolidation/
As of January 30, 2010 Pep Boys Guarantors Non-Guarantors Elimination Consolidated
ASSETS
Current assets:
Cash and cash equivalents ...... $ 25,844 $ 10,279 $ 3,203 $ — $ 39,326
Accounts receivable, net ........ 13,032 9,951 — — 22,983
Merchandise inventories ........ 195,314 363,804 — — 559,118
Prepaid expenses ............. 12,607 15,070 14,255 (17,148) 24,784
Other current assets .......... 1,101 2,667 67,038 (5,378) 65,428
Assets held for disposal ........ 1,045 3,393 — — 4,438
Total current assets ........... 248,943 405,164 84,496 (22,526) 716,077
Property and equipment—net .... 232,115 462,128 31,544 (19,337) 706,450
Investment in subsidiaries ...... 1,755,426 — — (1,755,426) —
Intercompany receivable ....... — 1,058,132 83,953 (1,142,085) —
Deferred income taxes ......... 11,200 46,971 — — 58,171
Other long-term assets ......... 17,566 822 — — 18,388
Total assets ................. $2,265,250 $1,973,217 $199,993 $(2,939,374) $1,499,086
LIABILITIES AND
STOCKHOLDERS’ EQUITY
Current liabilities:
Accounts payable ............. $ 202,974 $ — $ — $ — $ 202,974
Trade payable program liability . . . 34,099 — — — 34,099
Accrued expenses ............ 24,042 62,106 173,429 (17,161) 242,416
Deferred income taxes ......... 6,626 28,723 — (5,365) 29,984
Current maturities of long-term
debt .................... 1,079 — — — 1,079
Total current liabilities ......... 268,820 90,829 173,429 (22,526) 510,552
Long-term debt less current
maturities ................ 306,201 — — — 306,201
Other long-term liability ........ 35,125 38,808 — — 73,933
Deferred gain from asset sales . . . 69,724 114,718 — (19,337) 165,105
Intercompany liabilities ........ 1,142,085 — — (1,142,085) —
Total stockholders’ equity ....... 443,295 1,728,862 26,564 (1,755,426) 443,295
Total liabilities and stockholders’
equity ................... $2,265,250 $1,973,217 $199,993 $(2,939,374) $1,499,086
78