Pep Boys 2010 Annual Report Download - page 24
Download and view the complete annual report
Please find page 24 of the 2010 Pep Boys annual report below. You can navigate through the pages in the report by either clicking on the pages listed below, or by using the keyword search tool below to find specific information within the annual report.-
 1
1 -
2
-
3
-
4
-
5
-
6
-
7
-
8
-
9
-
10
-
11
-
12
-
13
-
 14
14 -
 15
15 -
 16
16 -
 17
17 -
 18
18 -
 19
19 -
 20
20 -
 21
21 -
 22
22 -
 23
23 -
 24
24 -
 25
25 -
 26
26 -
 27
27 -
 28
28 -
 29
29 -
 30
30 -
 31
31 -
 32
32 -
 33
33 -
 34
34 -
35
-
36
-
37
-
38
-
39
-
40
-
41
-
42
-
43
-
44
-
45
-
46
-
47
-
48
-
49
-
50
-
51
-
52
-
53
-
54
-
55
-
56
-
57
-
58
-
59
-
60
-
61
-
62
-
63
-
64
-
65
-
66
-
67
-
68
-
69
-
70
-
71
-
72
-
73
-
74
-
75
-
76
-
77
-
78
-
79
-
80
-
81
-
82
-
83
-
84
-
85
-
86
-
87
-
88
-
89
-
90
-
91
-
92
-
93
-
94
-
95
-
96
-
97
-
98
-
99
-
100
-
101
-
102
-
103
-
104
-
105
-
106
-
107
-
108
-
109
-
110
-
111
-
112
-
113
-
114
-
115
-
116
-
117
-
118
-
119
-
120
-
121
-
122
-
123
-
124
-
125
-
126
-
127
-
128
-
129
-
130
-
131
-
132
-
133
-
134
-
135
-
136
-
137
-
138
-
139
-
140
-
141
-
142
-
143
-
144
-
145
-
146
-
147
-
148
-
149
-
150
-
151
-
152
-
153
-
154
-
155
-
156
-
157
-
158
-
159
-
160
 |
 |

18
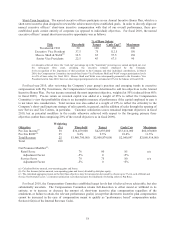
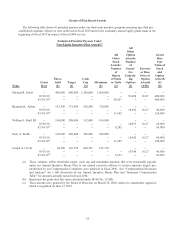
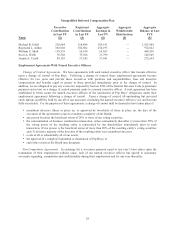
Short-Term Incentives. The named executive officers participate in our Annual Incentive Bonus Plan, which is a
short-term incentive plan designed to reward the achievement of pre-established goals. In order to directly align our
named executive officers’ short-term incentive compensation with that of our overall performance, these pre-
established goals consist entirely of corporate (as opposed to individual) objectives. For fiscal 2010, the named
executive officers’ annual short-term incentive opportunity was as follows:
% of Base Salary
Title Threshold Target Cash Cap(a) Maximum
President & CEO 50 100 150 200
Executive Vice President 37.5 75 112.5 150
Messrs. Shull & Webb(b) 32.5 65 97.5 130
Senior Vice Presidents 22.5 45 67.5 90
(a) Amounts achieved above the “cash cap” percentage up to the “maximum” percentage are earned and paid out over
the subsequent three years, assuming the executive remains employed by the Company.
(b) In recognition of the importance of their positions to the Company and their individual contributions, in March
2010, the Compensation Committee increased then Senior Vice Presidents Shull and Webb’s target participation levels
to 65% of base salary for fiscal 2010. Messrs. Shull and Webb were subsequently promoted to the Executive Vice
President level in June 2010, however, their target participation levels remained at 65% for the balance of fiscal 2010.
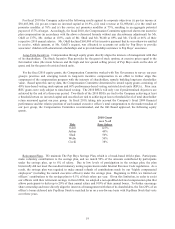
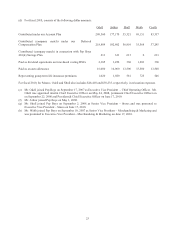
For fiscal year 2010, after reviewing the Company’s peer group’s practices and emerging trends in executive
compensation with Pay Governance, the Compensation Committee determined to add two objectives to the Annual
Incentive Bonus Plan. Pre-tax income remained the most important objective, weighted at 50% (reduced from 80%
in fiscal 2009). Pre-tax return on invested capital was added at a weight of 25% to reflect the Compensation
Committee’s view that profitability alone is an incomplete measure of performance if the capital employed to earn it
is not taken into consideration. Total revenue was also added at a weight of 25% to reflect the criticality to the
Company’s short- and long-term strategy of sales growth, in general, and the addition of sales through the opening of
new Service and Tire Centers, in particular. Customer satisfaction scores remained important objectives in fiscal
2010, but as potential modifiers to the results otherwise achieved with respect to the foregoing primary three
objectives (rather than comprising 20% of the overall objectives as in fiscal 2009).
Objective
Weighting
(%) Threshold Target Cash Cap Maximum
Pre-Tax Income(a) 50 $36,459,000 $42,893,000 $53,616,000 $60,050,000
Pre-Tax ROIC(b) 25 8.4% 9.3% 10.4% 11.5%
Total Revenue 25 $1,980,780,000 $2,000,879,000 $2,040,897 $2,080,914,000
Total 100
Net Promotor Modifier(c) :
Retail Score 76 80 85 n/a
Adjustment Factor -5% 0 +5%
Service Score 70 75 80 n/a
Adjustment Factor -5% 0 +5%
(a) Calculated before unusual, non-operating gains and losses.
(b) Pre-Tax Income (before unusual, non-operating gains and losses) divided by debt plus equity.
(c) The calculated aggregate payout on the first three objectives may be increased or decreased by a factor up to 5% for each of Retail and
Service Net Promoter scores - a customer satisfaction score that measures the likelihood of referring others to Pep Boys.
For fiscal 2010, the Compensation Committee established target levels that it believed were achievable, but also
substantially uncertain. The Compensation Committee retains full discretion to either award or withhold in its
entirety, or to increase or decrease the amount of, short-term incentive plan compensation regardless of the
attainment, or failure to attain, the relevant performance goal(s) (except that short-term incentive plan compensation
cannot be increased in the case of compensation meant to qualify as “performance based” compensation under
Section 162(m) of the Internal Revenue Code).