Pep Boys 2010 Annual Report Download - page 31
Download and view the complete annual report
Please find page 31 of the 2010 Pep Boys annual report below. You can navigate through the pages in the report by either clicking on the pages listed below, or by using the keyword search tool below to find specific information within the annual report.-
 1
1 -
2
-
3
-
4
-
5
-
6
-
7
-
8
-
9
-
10
-
11
-
12
-
13
-
14
-
15
-
16
-
17
-
18
-
19
-
20
-
 21
21 -
 22
22 -
 23
23 -
 24
24 -
 25
25 -
 26
26 -
 27
27 -
 28
28 -
 29
29 -
 30
30 -
 31
31 -
 32
32 -
 33
33 -
 34
34 -
 35
35 -
 36
36 -
 37
37 -
 38
38 -
 39
39 -
 40
40 -
 41
41 -
42
-
43
-
44
-
45
-
46
-
47
-
48
-
49
-
50
-
51
-
52
-
53
-
54
-
55
-
56
-
57
-
58
-
59
-
60
-
61
-
62
-
63
-
64
-
65
-
66
-
67
-
68
-
69
-
70
-
71
-
72
-
73
-
74
-
75
-
76
-
77
-
78
-
79
-
80
-
81
-
82
-
83
-
84
-
85
-
86
-
87
-
88
-
89
-
90
-
91
-
92
-
93
-
94
-
95
-
96
-
97
-
98
-
99
-
100
-
101
-
102
-
103
-
104
-
105
-
106
-
107
-
108
-
109
-
110
-
111
-
112
-
113
-
114
-
115
-
116
-
117
-
118
-
119
-
120
-
121
-
122
-
123
-
124
-
125
-
126
-
127
-
128
-
129
-
130
-
131
-
132
-
133
-
134
-
135
-
136
-
137
-
138
-
139
-
140
-
141
-
142
-
143
-
144
-
145
-
146
-
147
-
148
-
149
-
150
-
151
-
152
-
153
-
154
-
155
-
156
-
157
-
158
-
159
-
160
 |
 |

25
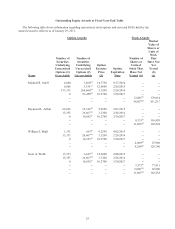
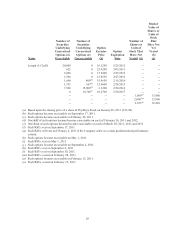
Outstanding Equity Awards at Fiscal Year-End Table
The following table shows information regarding unexercised stock options and unvested RSUs held by the
named executive officers as of January 29, 2011.
Option Awards Stock Awards
Name
Number of
Securities
Underlying
Unexercised
Options (#)
Exercisable
Number of
Securities
Underlying
Unexercised
Options (#)
Unexercisable
Option
Exercise
Price
($)
Option
Expiration
Date
Number of
Shares or
Units of
Stock That
Have Not
Vested (#)
Market
Value of
Shares or
Units of
Stock
That
Have Not
Yet
Vested
($)
(a)
Michael R. Odell 4,800 1,200(b) 14.7750 9/17/2014 -- --
6,666 3,334 (c) 12.0600 2/28/2015 -- --
133,333 266,666(d) 3.1200 2/26/2016 -- --
0 93,458(e) 10.2700 3/30/2017 -- --
-- -- -- -- 12,805(f) 179,014
-- -- -- -- 58,027(g) 811,217
Raymond L. Arthur 66,666 33,334(h) 9.0950 5/01/2015 -- --
13,333 26,667(d) 3.1200 2/26/2016 -- --
0 18,692(e) 10.2700 3/30/2017 -- --
-- -- -- -- 8,333(i) 116,495
-- -- -- -- 11,605(g) 162,238
William E. Shull 1,333 667(j) 9.2550 9/02/2015 -- --
13,333 26,667(d) 3.1200 2/26/2016 -- --
0 14,953(e) 10.2700 3/30/2017 -- --
-- -- -- -- 2,000(k) 27,960
-- -- -- -- 9,284(g) 129,790
Scott A. Webb 13,333 6,667(c) 12.0600 2/28/2015 -- --
13,333 26,667(d) 3.1200 2/26/2016 -- --
0 18,692(e) 10.2700 3/30/2017 -- --
-- -- -- -- 5,573(l) 77,911
-- -- -- -- 5,000(m) 69,900
-- -- -- -- 11,605(g) 162,238