Pep Boys 2010 Annual Report Download - page 59
Download and view the complete annual report
Please find page 59 of the 2010 Pep Boys annual report below. You can navigate through the pages in the report by either clicking on the pages listed below, or by using the keyword search tool below to find specific information within the annual report.-
 1
1 -
2
-
3
-
4
-
5
-
6
-
7
-
8
-
9
-
10
-
11
-
12
-
13
-
14
-
15
-
16
-
17
-
18
-
19
-
20
-
21
-
22
-
23
-
24
-
25
-
26
-
27
-
28
-
29
-
30
-
31
-
32
-
33
-
34
-
35
-
36
-
37
-
38
-
39
-
40
-
41
-
42
-
43
-
44
-
45
-
46
-
47
-
48
-
 49
49 -
 50
50 -
 51
51 -
 52
52 -
 53
53 -
 54
54 -
 55
55 -
 56
56 -
 57
57 -
 58
58 -
 59
59 -
 60
60 -
 61
61 -
 62
62 -
 63
63 -
 64
64 -
 65
65 -
 66
66 -
 67
67 -
 68
68 -
 69
69 -
70
-
71
-
72
-
73
-
74
-
75
-
76
-
77
-
78
-
79
-
80
-
81
-
82
-
83
-
84
-
85
-
86
-
87
-
88
-
89
-
90
-
91
-
92
-
93
-
94
-
95
-
96
-
97
-
98
-
99
-
100
-
101
-
102
-
103
-
104
-
105
-
106
-
107
-
108
-
109
-
110
-
111
-
112
-
113
-
114
-
115
-
116
-
117
-
118
-
119
-
120
-
121
-
122
-
123
-
124
-
125
-
126
-
127
-
128
-
129
-
130
-
131
-
132
-
133
-
134
-
135
-
136
-
137
-
138
-
139
-
140
-
141
-
142
-
143
-
144
-
145
-
146
-
147
-
148
-
149
-
150
-
151
-
152
-
153
-
154
-
155
-
156
-
157
-
158
-
159
-
160
 |
 |

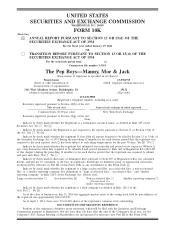
PART I
ITEM 1 BUSINESS
GENERAL
The Pep Boys—Manny, Moe & Jack and subsidiaries (‘‘the Company’’) began operations in 1921
and is the only national chain offering automotive service, tires, parts and accessories. This positioning
allows us to streamline the distribution channel and pass the savings on to our customer facilitating our
vision to be the automotive solutions provider of choice for the value-oriented customer. Our primary
operating unit is our Supercenter format (averaging 20,600 sq.ft.), which serves both ‘‘do-it-for-me’’
(‘‘DIFM’’, which includes service labor, installed merchandise and tires) and retail (which includes
‘‘do-it-yourself’’, or ‘‘DIY’’, and commercial) customers with the highest quality service offerings and
merchandise. Most of our Supercenters have a commercial sales program that provides commercial
credit and prompt delivery of tires, parts and other products to local, regional and national repair
shops and dealers. In 2009, as part of our long-term strategy to lead with automotive service, we began
complementing our existing Supercenter store base with Service & Tire Centers (averaging 5,800 sq.ft.).
The Service & Tire Centers are designed to capture market share and leverage our existing
Supercenters and support infrastructure. In 2010, we introduced new, smaller format (14,000 sq.ft.)
Supercenters. The new, smaller Supercenters are designed to provide our customers with our complete
offering of automotive service, tires, parts and accessories in a more efficient and cost-effective
footprint. In total, as of January 29, 2011, the Company operated approximately 11,930,000 of gross
square feet of retail space, including service bays.
In fiscal 2010, we opened 28 new Service & Tire Centers and seven new Supercenters. We are
targeting a total of 50 new Service & Tire Centers and five Supercenters in fiscal 2011, and 75 new
Service & Tire Centers and ten Supercenters in fiscal 2012. We expect to lease new Service & Tire
Center and Supercenter locations, as we believe that there are sufficient existing available locations in
the marketplace with attractive lease terms to enable our expansion.
The following table sets forth the percentage of total revenues from continuing operations
contributed by each class of similar products or services for the Company and should be read in
conjunction with the Consolidated Financial Statements and Notes thereto included elsewhere herein:
Year ended
January 29, January 30, January 31,
2011 2010 2009
Parts and accessories ..................... 63.5% 63.9% 65.1%
Tires ................................ 16.9 16.4 16.3
Total merchandise sales ................... 80.4 80.3 81.4
Service labor ........................... 19.6 19.7 18.6
Total revenues .......................... 100.0% 100.0% 100.0%
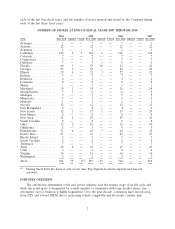
As of January 29, 2011, the Company operated its stores in 35 states and Puerto Rico. The
following table indicates, by state, the number of stores the Company had in operation at the end of
1