Pep Boys 2010 Annual Report Download - page 60
Download and view the complete annual report
Please find page 60 of the 2010 Pep Boys annual report below. You can navigate through the pages in the report by either clicking on the pages listed below, or by using the keyword search tool below to find specific information within the annual report.-
 1
1 -
2
-
3
-
4
-
5
-
6
-
7
-
8
-
9
-
10
-
11
-
12
-
13
-
14
-
15
-
16
-
17
-
18
-
19
-
20
-
21
-
22
-
23
-
24
-
25
-
26
-
27
-
28
-
29
-
30
-
31
-
32
-
33
-
34
-
35
-
36
-
37
-
38
-
39
-
40
-
41
-
42
-
43
-
44
-
45
-
46
-
47
-
48
-
49
-
 50
50 -
 51
51 -
 52
52 -
 53
53 -
 54
54 -
 55
55 -
 56
56 -
 57
57 -
 58
58 -
 59
59 -
 60
60 -
 61
61 -
 62
62 -
 63
63 -
 64
64 -
 65
65 -
 66
66 -
 67
67 -
 68
68 -
 69
69 -
 70
70 -
71
-
72
-
73
-
74
-
75
-
76
-
77
-
78
-
79
-
80
-
81
-
82
-
83
-
84
-
85
-
86
-
87
-
88
-
89
-
90
-
91
-
92
-
93
-
94
-
95
-
96
-
97
-
98
-
99
-
100
-
101
-
102
-
103
-
104
-
105
-
106
-
107
-
108
-
109
-
110
-
111
-
112
-
113
-
114
-
115
-
116
-
117
-
118
-
119
-
120
-
121
-
122
-
123
-
124
-
125
-
126
-
127
-
128
-
129
-
130
-
131
-
132
-
133
-
134
-
135
-
136
-
137
-
138
-
139
-
140
-
141
-
142
-
143
-
144
-
145
-
146
-
147
-
148
-
149
-
150
-
151
-
152
-
153
-
154
-
155
-
156
-
157
-
158
-
159
-
160
 |
 |

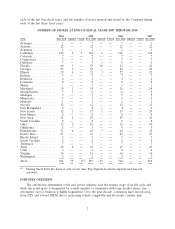
each of the last four fiscal years, and the number of stores opened and closed by the Company during
each of the last three fiscal years:
NUMBER OF STORES AT END OF FISCAL YEARS 2007 THROUGH 2010
2010 2009 2008 2007
State Year End Opened Closed Year End Opened Closed Year End Opened Closed Year End
Alabama ............. 1 — — 1 — — 1 — — 1
Arizona .............. 22 — — 22 — — 22 — — 22
Arkansas ............. 1 — — 1 — — 1 — — 1
California ............ 129 6 1 124 6 — 118 — — 118
Colorado ............. 7 — — 7 — — 7 — — 7
Connecticut ........... 7 — — 7 — — 7 — — 7
Delaware ............ 7 — — 7 1 — 6 — — 6
Florida .............. 60 7 — 53 10 — 43 — — 43
Georgia ............. 25 3 — 22 — — 22 — — 22
Illinois .............. 29 4 — 25 3 — 22 — — 22
Indiana .............. 7 — — 7 — — 7 — — 7
Kentucky ............. 4 — — 4 — — 4 — — 4
Louisiana ............ 8 — — 8 — — 8 — — 8
Maine ............... 1 — — 1 — — 1 — — 1
Maryland ............ 19 1 — 18 — — 18 — — 18
Massachusetts ......... 7 1 — 6 — — 6 — — 6
Michigan ............. 5 — — 5 — — 5 — — 5
Minnesota ............ 3 — — 3 — — 3 — — 3
Missouri ............. 1 — — 1 — — 1 — — 1
Nevada .............. 12 — — 12 — — 12 — — 12
New Hampshire ........ 4 — — 4 — — 4 — — 4
New Jersey ........... 32 1 — 31 2 — 29 — — 29
New Mexico .......... 8 — — 8 — — 8 — — 8
New York ............ 31 2 — 29 — — 29 — — 29
North Carolina ........ 8 — — 8 — — 8 — — 8
Ohio................ 12 2 — 10 — — 10 — — 10
Oklahoma ............ 5 — — 5 — — 5 — — 5
Pennsylvania .......... 51 6 — 45 3 — 42 — — 42
Puerto Rico .......... 27 — — 27 — — 27 — — 27
Rhode Island ......... 2 — — 2 — — 2 — — 2
South Carolina ........ 6 — — 6 — — 6 — — 6
Tennessee ............ 7 — — 7 — — 7 — — 7
Texas ............... 49 2 — 47 — — 47 — — 47
Utah................ 6 — — 6 — — 6 — — 6
Virginia .............. 16 — — 16 — — 16 — — 16
Washington ........... 2 — — 2 — — 2 — — 2
Total ................ 621 35 1
(1) 587 25 — 562 — — 562
(1) During fiscal 2010 the lease at one of our nine Pep Express locations expired and was not
renewed.
INDUSTRY OVERVIEW
The automotive aftermarket retail and service industry is in the mature stage of its life cycle and
while the retail space is dominated by a small number of companies with large market shares, the
automotive service business is highly fragmented. Over the past decade, consumers have moved away
from DIY and toward DIFM due to increasing vehicle complexity and electronic content, and
2