Pep Boys 2010 Annual Report Download - page 118
Download and view the complete annual report
Please find page 118 of the 2010 Pep Boys annual report below. You can navigate through the pages in the report by either clicking on the pages listed below, or by using the keyword search tool below to find specific information within the annual report.-
 1
1 -
2
-
3
-
4
-
5
-
6
-
7
-
8
-
9
-
10
-
11
-
12
-
13
-
14
-
15
-
16
-
17
-
18
-
19
-
20
-
21
-
22
-
23
-
24
-
25
-
26
-
27
-
28
-
29
-
30
-
31
-
32
-
33
-
34
-
35
-
36
-
37
-
38
-
39
-
40
-
41
-
42
-
43
-
44
-
45
-
46
-
47
-
48
-
49
-
50
-
51
-
52
-
53
-
54
-
55
-
56
-
57
-
58
-
59
-
60
-
61
-
62
-
63
-
64
-
65
-
66
-
67
-
68
-
69
-
70
-
71
-
72
-
73
-
74
-
75
-
76
-
77
-
78
-
79
-
80
-
81
-
82
-
83
-
84
-
85
-
86
-
87
-
88
-
89
-
90
-
91
-
92
-
93
-
94
-
95
-
96
-
97
-
98
-
99
-
100
-
101
-
102
-
103
-
104
-
105
-
106
-
107
-
 108
108 -
 109
109 -
 110
110 -
 111
111 -
 112
112 -
 113
113 -
 114
114 -
 115
115 -
 116
116 -
 117
117 -
 118
118 -
 119
119 -
 120
120 -
 121
121 -
 122
122 -
 123
123 -
 124
124 -
 125
125 -
 126
126 -
 127
127 -
 128
128 -
129
-
130
-
131
-
132
-
133
-
134
-
135
-
136
-
137
-
138
-
139
-
140
-
141
-
142
-
143
-
144
-
145
-
146
-
147
-
148
-
149
-
150
-
151
-
152
-
153
-
154
-
155
-
156
-
157
-
158
-
159
-
160
 |
 |
THE PEP BOYS—MANNY, MOE & JACK AND SUBSIDIARIES
NOTES TO CONSOLIDATED FINANCIAL STATEMENTS (Continued)
Years ended January 29, 2011, January 30, 2010 and January 31, 2009
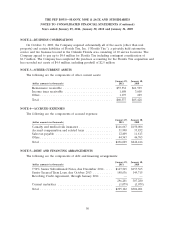
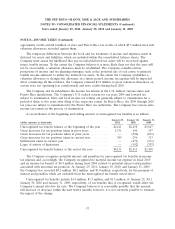
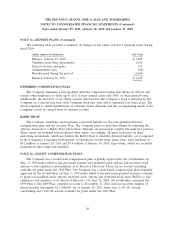
NOTE 11—STORE CLOSURES AND ASSET IMPAIRMENTS (Continued)
During fiscal 2009, the Company sold four stores for $3.6 million and recorded a net gain of
$0.2 million of which $0.1 million is reported in discontinued operations. The Company also decided to
reopen one store and moved the carrying value of $1.7 million to property and equipment. During
fiscal 2009 in response to a continuing weak real estate market, the Company reduced its prices for
certain properties and recorded a $3.1 million impairment charge, of which $2.2 million was charged to
merchandise cost of sales, $0.7 million was charged to service cost of sales and $0.2 million (pretax)
was charged to discontinued operations.
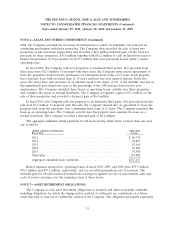
During fiscal 2008, the Company sold six stores for $6.7 million and recorded a net gain of
$0.4 million of which $0.1 million is reported in discontinued operations. During fiscal 2008 in response
to a continuing weak real estate market, the Company reduced its prices for certain properties and
recorded a $5.4 million impairment charge, of which $2.8 million was charged to merchandise cost of
sales, $0.6 million was charged to service cost of sales and $1.9 million (pretax) was charged to
discontinued operations.
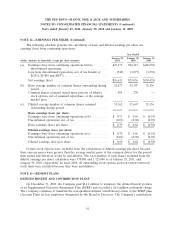
NOTE 12—EARNINGS PER SHARE
Basic earnings per share is based on net earnings divided by the weighted average number of
shares outstanding during the period. Stock options were dilutive in fiscal 2010 and 2009 and as such
were included in the diluted earnings per share calculation. Stock options were anti-dilutive in fiscal
2008, as the Company generated a net loss, and are excluded from the diluted earnings per share
calculation.
60