Pep Boys 2010 Annual Report Download - page 28
Download and view the complete annual report
Please find page 28 of the 2010 Pep Boys annual report below. You can navigate through the pages in the report by either clicking on the pages listed below, or by using the keyword search tool below to find specific information within the annual report.-
 1
1 -
2
-
3
-
4
-
5
-
6
-
7
-
8
-
9
-
10
-
11
-
12
-
13
-
14
-
15
-
16
-
17
-
 18
18 -
 19
19 -
 20
20 -
 21
21 -
 22
22 -
 23
23 -
 24
24 -
 25
25 -
 26
26 -
 27
27 -
 28
28 -
 29
29 -
 30
30 -
 31
31 -
 32
32 -
 33
33 -
 34
34 -
 35
35 -
 36
36 -
 37
37 -
 38
38 -
39
-
40
-
41
-
42
-
43
-
44
-
45
-
46
-
47
-
48
-
49
-
50
-
51
-
52
-
53
-
54
-
55
-
56
-
57
-
58
-
59
-
60
-
61
-
62
-
63
-
64
-
65
-
66
-
67
-
68
-
69
-
70
-
71
-
72
-
73
-
74
-
75
-
76
-
77
-
78
-
79
-
80
-
81
-
82
-
83
-
84
-
85
-
86
-
87
-
88
-
89
-
90
-
91
-
92
-
93
-
94
-
95
-
96
-
97
-
98
-
99
-
100
-
101
-
102
-
103
-
104
-
105
-
106
-
107
-
108
-
109
-
110
-
111
-
112
-
113
-
114
-
115
-
116
-
117
-
118
-
119
-
120
-
121
-
122
-
123
-
124
-
125
-
126
-
127
-
128
-
129
-
130
-
131
-
132
-
133
-
134
-
135
-
136
-
137
-
138
-
139
-
140
-
141
-
142
-
143
-
144
-
145
-
146
-
147
-
148
-
149
-
150
-
151
-
152
-
153
-
154
-
155
-
156
-
157
-
158
-
159
-
160
 |
 |

22
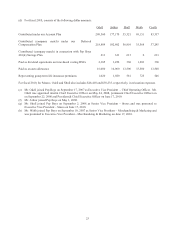
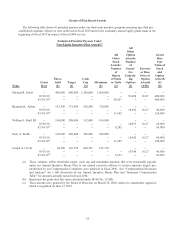
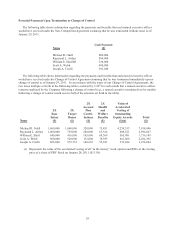
Summary Compensation Table
The following table provides information regarding the fiscal 2010 compensation for Pep Boys’ CEO, CFO and
the three other executive officers that received the highest compensation in fiscal 2010. These executives are
referred to herein as the “named executive officers.” As explained in our Compensation Discussion and Analysis,
the compensation provided to our named executive officers consists of base salaries, short-term cash incentives,
long-term equity incentives, retirement plan contributions and heath and welfare benefits.
Name and
Principal Position
Fiscal
Year
Salary
($)
Stock
Awards
($)
(a)
Option
Awards
($)
(b)
Non-
Equity
Incentive
Plan
Compen-
sation
($)
(c)
All
Other
Compen-
sation
($)
(d)
Total
($)
Michael R. Odell 2010 800,000 600,000 400,000 1,094,424 448,382 3,391,216
CEO(e) 2009 800,000 -- 670,073 1,145,600 392,250 3,007,923
2008 723,846 -- 38,424 -- 113,060 875,330
Raymond L. Arthur 2010 500,000 120,000 80,000 513,012 298,655 1,511,667
EVP – CFO(f) 2009 500,000 -- 68,885 607,313 317,544 1,493,742
2008 369,231 228,250 292,810 375,000 143,126 1,408,417
William E. Shull III 2010 320,000 96,000 64,000 284,550 127,285 922,070
EVP–Stores(g) 2009 320,000 -- 68,885 233,208 104,414 726,507
2008 131,500 56,340 5,725 60,369 65,136 319,070
Scott A. Webb 2010 400,000 120,000 80,000 355,688 120,547 1,076,235
EVP – Merch. & 2009 400,000 -- 68,885 291,510 71,181 831,576
Marketing(h) 2008 400,000 177,300 76,848 66,060 77,933 798,141
Joseph A. Cirelli 2010 302,509 69,000 46,000 186,229 135,601 739,339
SVP – Corporate 2009 300,020 -- 38,748 218,647 121,819 679,234
Development 2008 300,020 70,920 7,685 49,548 1,437,518 1,865,691
(a) Represents the grant date fair value calculated under SFAS No. 123(R).
(b) Represents the grant date fair value calculated under SFAS No. 123(R).
(c) Represents amounts earned under our Annual Incentive Compensation Plan in the year reported, that were paid,
or payable but deferred at the executive officer’s election, in the following fiscal year. For fiscal 2010, the
amount reflected for Mr. Odell does not include $60,000 that he was otherwise entitled to receive, but declined.
Such amount, at Mr. Odell’s request, was allocated to an account set aside by Pep Boys to provide associates’
children with educational scholarships and to provide hardship assistance to Pep Boys’ associates.