Pep Boys 2010 Annual Report Download - page 142
Download and view the complete annual report
Please find page 142 of the 2010 Pep Boys annual report below. You can navigate through the pages in the report by either clicking on the pages listed below, or by using the keyword search tool below to find specific information within the annual report.-
 1
1 -
2
-
3
-
4
-
5
-
6
-
7
-
8
-
9
-
10
-
11
-
12
-
13
-
14
-
15
-
16
-
17
-
18
-
19
-
20
-
21
-
22
-
23
-
24
-
25
-
26
-
27
-
28
-
29
-
30
-
31
-
32
-
33
-
34
-
35
-
36
-
37
-
38
-
39
-
40
-
41
-
42
-
43
-
44
-
45
-
46
-
47
-
48
-
49
-
50
-
51
-
52
-
53
-
54
-
55
-
56
-
57
-
58
-
59
-
60
-
61
-
62
-
63
-
64
-
65
-
66
-
67
-
68
-
69
-
70
-
71
-
72
-
73
-
74
-
75
-
76
-
77
-
78
-
79
-
80
-
81
-
82
-
83
-
84
-
85
-
86
-
87
-
88
-
89
-
90
-
91
-
92
-
93
-
94
-
95
-
96
-
97
-
98
-
99
-
100
-
101
-
102
-
103
-
104
-
105
-
106
-
107
-
108
-
109
-
110
-
111
-
112
-
113
-
114
-
115
-
116
-
117
-
118
-
119
-
120
-
121
-
122
-
123
-
124
-
125
-
126
-
127
-
128
-
129
-
130
-
131
-
 132
132 -
 133
133 -
 134
134 -
 135
135 -
 136
136 -
 137
137 -
 138
138 -
 139
139 -
 140
140 -
 141
141 -
 142
142 -
 143
143 -
 144
144 -
 145
145 -
 146
146 -
 147
147 -
 148
148 -
 149
149 -
 150
150 -
 151
151 -
 152
152 -
153
-
154
-
155
-
156
-
157
-
158
-
159
-
160
 |
 |

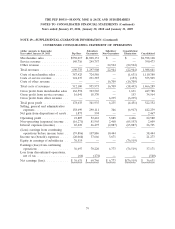
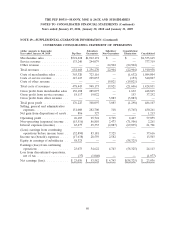
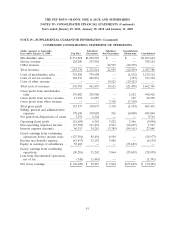
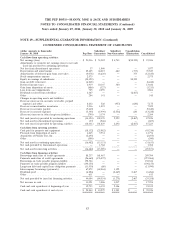
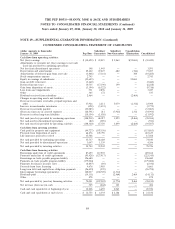
THE PEP BOYS—MANNY, MOE & JACK AND SUBSIDIARIES
NOTES TO CONSOLIDATED FINANCIAL STATEMENTS (Continued)
Years ended January 29, 2011, January 30, 2010 and January 31, 2009
NOTE 19—SUPPLEMENTAL GUARANTOR INFORMATION (Continued)
CONDENSED CONSOLIDATING STATEMENT OF CASH FLOWS
(dollar amounts in thousands) Subsidiary Subsidiary Consolidation
January 31, 2009 Pep Boys Guarantors Non-Guarantors Elimination Consolidated
Cash flows from operating activities:
Net (loss) earnings ......................... $(30,429) $ 49,819 $ 5,864 $(55,683) $ (30,429)
Adjustments to reconcile net (loss) earnings to net cash
(used in) provided by continuing operations:
Net loss from discontinued operations ............. 148 1,443 — — 1,591
Depreciation and amortization .................. 25,442 47,427 682 (344) 73,207
Amortization of deferred gain from asset sale ........ (3,468) (7,161) — 344 (10,285)
Stock compensation expense ................... 2,743 — — — 2,743
Equity in earnings of subsidiaries ................ (55,683) — — 55,683 —
Gain on debt retirement ...................... (3,460) — — — (3,460)
Deferred income taxes ....................... 10,733 (17,190) 199 — (6,258)
Gain from disposition of assets .................. (3,394) (6,322) — — (9,716)
Loss from asset impairments ................... 531 2,896 — — 3,427
Other .................................. 365 172 — — 537
Dividends received from subsidiary ............... 2,464 — — (2,464) —
Changes in operating assets and liabilities:
Decrease in accounts receivable, prepaid expenses and
other ................................. 17,926 2,211 5,079 (1,312) 23,904
Increase in merchandise inventories ............... (328) (3,451) — — (3,779)
Decrease in accounts payable ................... (33,083) — — — (33,083)
(Decrease) increase in accrued expenses ............ (28,591) 211 (7,925) 1,312 (34,993)
Decrease in other long-term liabilities ............. (10,154) (1,838) — — (11,992)
Net cash (used in) provided by continuing operations . . . (108,238) 68,217 3,899 (2,464) (38,586)
Net cash used in discontinued operations ........... (82) (839) — — (921)
Net cash (used in) provided by operating activities ..... (108,320) 67,378 3,899 (2,464) (39,507)
Cash flows from investing activities:
Cash paid for property and equipment ............. (44,727) (107,156) — — (151,883)
Proceeds from disposition of assets ............... 64,876 145,759 — — 210,635
Life insurance proceeds received ................. 15,588 — — — 15,588
Net cash provided by continuing operations .......... 35,737 38,603 — — 74,340
Net cash provided by discontinued operations ........ 3,047 1,339 — — 4,386
Net cash provided by investing activities ............ 38,784 39,942 — — 78,726
Cash flows from financing activities:
Borrowings under line of credit agreements .......... 87,659 117,503 — — 205,162
Payments under line of credit agreements ........... (95,428) (127,917) — — (223,345)
Borrowings on trade payable program liability ........ 196,680 — — — 196,680
Payments on trade payable program liability ......... (179,004) — — — (179,004)
Payments for finance issuance costs ............... (6,847) (89) — — (6,936)
Proceeds from lease financing .................. 4,676 3,985 — — 8,661
Long-term debt and capital lease obligation payments . . . (26,459) (339) — — (26,798)
Intercompany borrowings (payments) .............. 102,037 (100,725) (1,312) — —
Dividends paid ............................ (14,111) — (2,464) 2,464 (14,111)
Other .................................. 878 — — — 878
Net cash provided by (used in) financing activities ...... 70,081 (107,582) (3,776) 2,464 (38,813)
Net increase (decrease) in cash ................. 545 (262) 123 — 406
Cash and cash equivalents at beginning of year ....... 12,208 6,655 2,063 — 20,926
Cash and cash equivalents at end of year ........... $ 12,753 $ 6,393 $ 2,186 $ — $ 21,332
84