Pep Boys 2010 Annual Report Download - page 32
Download and view the complete annual report
Please find page 32 of the 2010 Pep Boys annual report below. You can navigate through the pages in the report by either clicking on the pages listed below, or by using the keyword search tool below to find specific information within the annual report.-
 1
1 -
2
-
3
-
4
-
5
-
6
-
7
-
8
-
9
-
10
-
11
-
12
-
13
-
14
-
15
-
16
-
17
-
18
-
19
-
20
-
21
-
 22
22 -
 23
23 -
 24
24 -
 25
25 -
 26
26 -
 27
27 -
 28
28 -
 29
29 -
 30
30 -
 31
31 -
 32
32 -
 33
33 -
 34
34 -
 35
35 -
 36
36 -
 37
37 -
 38
38 -
 39
39 -
 40
40 -
 41
41 -
 42
42 -
43
-
44
-
45
-
46
-
47
-
48
-
49
-
50
-
51
-
52
-
53
-
54
-
55
-
56
-
57
-
58
-
59
-
60
-
61
-
62
-
63
-
64
-
65
-
66
-
67
-
68
-
69
-
70
-
71
-
72
-
73
-
74
-
75
-
76
-
77
-
78
-
79
-
80
-
81
-
82
-
83
-
84
-
85
-
86
-
87
-
88
-
89
-
90
-
91
-
92
-
93
-
94
-
95
-
96
-
97
-
98
-
99
-
100
-
101
-
102
-
103
-
104
-
105
-
106
-
107
-
108
-
109
-
110
-
111
-
112
-
113
-
114
-
115
-
116
-
117
-
118
-
119
-
120
-
121
-
122
-
123
-
124
-
125
-
126
-
127
-
128
-
129
-
130
-
131
-
132
-
133
-
134
-
135
-
136
-
137
-
138
-
139
-
140
-
141
-
142
-
143
-
144
-
145
-
146
-
147
-
148
-
149
-
150
-
151
-
152
-
153
-
154
-
155
-
156
-
157
-
158
-
159
-
160
 |
 |

26
Name
Number of
Securities
Underlying
Unexercised
Options (#)
Exercisable
Number of
Securities
Underlying
Unexercised
Options (#)
Unexercisable
Option
Exercise
Price
($)
Option
Expiration
Date
Number of
Shares or
Units of
Stock That
Have Not
Vested (#)
Market
Value of
Shares or
Units of
Stock
That
Have Not
Yet
Vested
($)
(a)
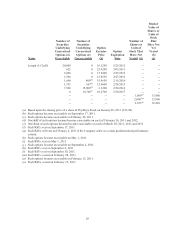
Joseph A. Cirelli 20,000 0 16.1250 5/29/2012 -- --
625 0 23.4200 3/03/2011 -- --
5,000 0 17.5400 2/25/2012 -- --
1,500 0 15.8550 2/27/2013 -- --
1,600 400(n) 15.9650 2/15/2014 -- --
1,333 667(c) 12.0600 2/28/2015 -- --
7,500 15,000(d) 3.1200 2/26/2016 -- --
0 10,748(e) 10.2700 3/30/2017 -- --
-- -- -- -- 1,000(o) 13,980
-- -- -- -- 2,000(m) 27,960
-- -- -- -- 6,673(g) 93,289
(a) Based upon the closing price of a share of Pep Boys Stock on January 28, 2011 ($13.98).
(b) Such options become exercisable on September 17, 2011.
(c) Such options became exercisable on February 28, 2011.
(d) One-half of such options became/become exercisable on each of February 26, 2011 and 2012.
(e) One-third of such options became/become exercisable on each of March 30, 2011, 2012 and 2013.
(f) Such RSUs vest on September 17, 2011.
(g) Such RSUs will vest on February 2, 2013 if the Company achieves certain predetermined performance
criteria.
(h) Such options become exercisable on May 1, 2011.
(i) Such RSUs vest on May 1, 2011.
(j) Such options become exercisable on September 2, 2011.
(k) Such RSUs vest on September 2, 2011.
(l) Such RSUs vest on September 10, 2011.
(m) Such RSUs vested on February 28, 2011.
(n) Such options became exercisable on February 15, 2011.
(o) Such RSUs vested on February 15, 2011.