Pep Boys 2010 Annual Report Download - page 86
Download and view the complete annual report
Please find page 86 of the 2010 Pep Boys annual report below. You can navigate through the pages in the report by either clicking on the pages listed below, or by using the keyword search tool below to find specific information within the annual report.-
 1
1 -
2
-
3
-
4
-
5
-
6
-
7
-
8
-
9
-
10
-
11
-
12
-
13
-
14
-
15
-
16
-
17
-
18
-
19
-
20
-
21
-
22
-
23
-
24
-
25
-
26
-
27
-
28
-
29
-
30
-
31
-
32
-
33
-
34
-
35
-
36
-
37
-
38
-
39
-
40
-
41
-
42
-
43
-
44
-
45
-
46
-
47
-
48
-
49
-
50
-
51
-
52
-
53
-
54
-
55
-
56
-
57
-
58
-
59
-
60
-
61
-
62
-
63
-
64
-
65
-
66
-
67
-
68
-
69
-
70
-
71
-
72
-
73
-
74
-
75
-
 76
76 -
 77
77 -
 78
78 -
 79
79 -
 80
80 -
 81
81 -
 82
82 -
 83
83 -
 84
84 -
 85
85 -
 86
86 -
 87
87 -
 88
88 -
 89
89 -
 90
90 -
 91
91 -
 92
92 -
 93
93 -
 94
94 -
 95
95 -
 96
96 -
97
-
98
-
99
-
100
-
101
-
102
-
103
-
104
-
105
-
106
-
107
-
108
-
109
-
110
-
111
-
112
-
113
-
114
-
115
-
116
-
117
-
118
-
119
-
120
-
121
-
122
-
123
-
124
-
125
-
126
-
127
-
128
-
129
-
130
-
131
-
132
-
133
-
134
-
135
-
136
-
137
-
138
-
139
-
140
-
141
-
142
-
143
-
144
-
145
-
146
-
147
-
148
-
149
-
150
-
151
-
152
-
153
-
154
-
155
-
156
-
157
-
158
-
159
-
160
 |
 |

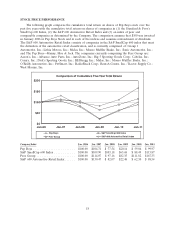
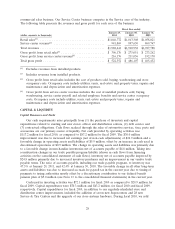
commercial sales business. Our Service Center business competes in the Service area of the industry.
The following table presents the revenues and gross profit for each area of the business.
Fiscal Year ended
January 29, January 30, January 31,
(dollar amounts in thousands) 2011 2010 2009
Retail sales(1) ...................................... $1,046,772 $1,013,308 $1,058,021
Service center revenue(2) ............................. 941,869 897,630 869,767
Total revenues ..................................... $1,988,641 $1,910,938 $1,927,788
Gross profit from retail sales(3) ......................... $ 306,176 $ 275,051 $ 273,262
Gross profit from service center revenue(4) ................ 216,176 211,056 192,170
Total gross profit ................................... $ 522,352 $ 486,107 $ 465,432
(1) Excludes revenues from installed products.
(2) Includes revenues from installed products.
(3) Gross profit from retail sales includes the cost of products sold, buying, warehousing and store
occupancy costs. Occupancy costs include utilities, rents, real estate and property taxes, repairs and
maintenance and depreciation and amortization expenses.
(4) Gross profit from service center revenue includes the cost of installed products sold, buying,
warehousing, service center payroll and related employee benefits and service center occupancy
costs. Occupancy costs include utilities, rents, real estate and property taxes, repairs and
maintenance and depreciation and amortization expenses.
CAPITAL & LIQUIDITY
Capital Resources and Needs
Our cash requirements arise principally from (1) the purchase of inventory and capital
expenditures related to existing and new stores, offices and distribution centers, (2) debt service and
(3) contractual obligations. Cash flows realized through the sales of automotive services, tires, parts and
accessories are our primary source of liquidity. Net cash provided by operating activities was
$117.2 million for fiscal 2010, as compared to $87.2 million for fiscal 2009. The $30.0 million
improvement was due to increased net earnings (net of non-cash adjustments) of $24.9 million and a
favorable change in operating assets and liabilities of $5.9 million, offset by an increase in cash used in
discontinued operations of $0.9 million. The change in operating assets and liabilities was primarily due
to a favorable change in merchandise inventories net of accounts payable of $4.8 million. Taking into
consideration changes in our trade payable program liability (shown as cash flows from financing
activities on the consolidated statement of cash flows), inventory net of accounts payable improved by
$24.8 million primarily due to increased inventory purchases and an improvement in our vendor trade
payable terms. The ratio of accounts payable, including our trade payable program, to inventory was
47.3% at January 29, 2011, and 42.4% at January 30, 2010. The favorable change in all other long-term
assets and liabilities was due to increased accruals for payroll tax in the current year due to timing of
payments to taxing authorities mostly offset by a discretionary contribution to our defined benefit
pension plan of $5.0 million (see Note 13 to the consolidated financial statements) in the current year.
Cash used in investing activities was $72.1 million for fiscal 2010 as compared to $29.9 million for
fiscal 2009. Capital expenditures were $70.3 million and $43.2 million, for fiscal 2010 and fiscal 2009,
respectively. Capital expenditures for fiscal 2010, in addition to our regularly-scheduled store and
distribution center improvements, included the addition of seven new Supercenters and 28 new
Service & Tire Centers and the upgrade of our store systems hardware. During fiscal 2010, we sold
28