Pep Boys 2010 Annual Report Download - page 75
Download and view the complete annual report
Please find page 75 of the 2010 Pep Boys annual report below. You can navigate through the pages in the report by either clicking on the pages listed below, or by using the keyword search tool below to find specific information within the annual report.
PART II
ITEM 5 MARKET FOR THE REGISTRANT’S COMMON EQUITY, RELATED STOCKHOLDER
MATTERS AND ISSUER PURCHASES OF EQUITY SECURITIES
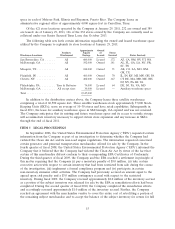
The common stock of The Pep Boys—Manny, Moe & Jack is listed on the New York Stock
Exchange under the symbol ‘‘PBY.’’ There were 4,634 registered shareholders as of April 1, 2011. The
following table sets forth for the periods listed, the high and low sale prices and the cash dividends
paid on the Company’s common stock.
MARKET PRICE PER SHARE
Market Price Per Share Cash Dividends
High Low Per Share
Fiscal 2010
Fourth quarter ....................... $15.96 $11.37 $0.03
Third quarter ....................... 12.00 8.82 0.03
Second quarter ...................... 13.26 7.86 0.03
First quarter ........................ 13.42 8.08 0.03
Fiscal 2009
Fourth quarter ....................... $ 9.29 $ 7.76 $0.03
Third quarter ....................... 10.69 8.40 0.03
Second quarter ...................... 10.83 5.87 0.03
First quarter ........................ 8.52 2.76 0.03
On March 12, 2009, the Board of Directors reduced the quarterly cash dividend to $0.03 per share.
It is the present intention of the Board of Directors to continue to pay this quarterly cash dividend;
however, the declaration and payment of future dividends will be determined by the Board of Directors
in its sole discretion and will depend upon the earnings, financial condition, and capital needs of the
Company and other factors which the Board of Directors deems relevant.
On January 26, 2010, the Company terminated the flexible employee benefits trust (the ‘‘Trust’’)
that was established on April 29, 1994 to fund a portion of the Company’s obligations arising from
various employee compensation and benefit plans. In accordance with the terms of the Trust, upon its
termination, the Trust’s sole asset, consisting of 2,195,270 shares of the Company’s common stock, was
transferred to the Company in exchange for the full satisfaction and discharge of all intercompany
indebtedness then owed by the Trust to the Company. The termination of the Trust had no impact on
the Company’s consolidated financial statements, except for the reclassification of the shares within the
shareholders equity section of the Company’s Consolidated Balance Sheets.
EQUITY COMPENSATION PLANS
The following table sets forth the Company’s shares authorized for issuance under its equity
compensation plans at January 29, 2011:
Number of Number of securities
securities to be Weighted remaining available
issued upon average for future issuance
exercise of exercise price under equity
outstanding of outstanding compensation plans
options, options, (excluding securities
warrants and warrants and reflected in the first
rights (a) rights (b) column (a))
Equity compensation plans approved by security
holders ................................. 2,493,181 $6.28 1,818,706
17


