Nordstrom 2007 Annual Report Download - page 67
Download and view the complete annual report
Please find page 67 of the 2007 Nordstrom annual report below. You can navigate through the pages in the report by either clicking on the pages listed below, or by using the keyword search tool below to find specific information within the annual report.-
 1
1 -
2
-
3
-
4
-
5
-
6
-
7
-
8
-
9
-
10
-
11
-
12
-
13
-
14
-
15
-
16
-
17
-
18
-
19
-
20
-
21
-
22
-
23
-
24
-
25
-
26
-
27
-
28
-
29
-
30
-
31
-
32
-
33
-
34
-
35
-
36
-
37
-
38
-
39
-
40
-
41
-
42
-
43
-
44
-
45
-
46
-
47
-
48
-
49
-
50
-
51
-
52
-
53
-
54
-
55
-
56
-
 57
57 -
 58
58 -
 59
59 -
 60
60 -
 61
61 -
 62
62 -
 63
63 -
 64
64 -
 65
65 -
 66
66 -
 67
67 -
 68
68 -
 69
69 -
 70
70 -
 71
71 -
 72
72 -
 73
73 -
 74
74 -
 75
75 -
 76
76 -
 77
77 -
78
-
79
-
80
-
81
-
82
-
83
-
84
 |
 |

Nordstrom, Inc. and subsidiaries 59
Nordstrom, Inc.
Notes to Consolidated Financial Statements
Dollar and share amounts in millions except per share and per option amounts
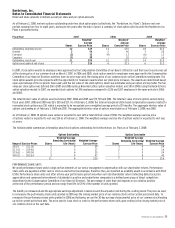
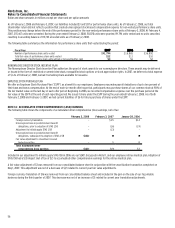
The following tables set forth the information for our reportable segments and a reconciliation to the consolidated totals:
Retail
Fiscal year 2007 Stores Direct Credit Other Eliminations Total
Net sales (a) $8,168 $633 — $27 — $8,828
Net sales increase 3.2% 16.7% N/A (74.7%) N/A 3.1%
Intersegment revenues — — $1 — $(1) —
Interest expense, net (b) — — (37) (37) — (74)
Finance charges and other, net (1) — 250 22 — 271
Depreciation and amortization 228 3 1 37 — 269
Earnings before income taxes 1,256 165 (11) (237) — 1,173
Earnings before income taxes
as a percentage of net sales 15.4% 26.0% N/A N/A N/A 13.3%
Goodwill 38 15 — — — 53
Acquired tradename — — — — — —
Assets (c) 2,555 133 1,783 1,129 — 5,600
Capital expenditures 431 35 3 32 — 501
Retail
Fiscal year 2006 Stores Direct Credit Other Eliminations Total
Net sales (a) $7,913 $543 - $105 — $8,561
Net sales increase 10.0% 23.5% N/A 20.3% N/A 10.8%
Intersegment revenues — — $1 — $(1) —
Interest expense, net (b) — — (11) (32) — (43)
Finance charges and other, net (1) — 214 26 — 239
Depreciation and amortization 237 3 1 44 — 285
Earnings before income taxes 1,203 134 73 (304) — 1,106
Earnings before income taxes
as a percentage of net sales 15.2% 24.7% N/A N/A N/A 12.9%
Goodwill 8 16 - 28 — 52
Acquired tradename — — - 84 — 84
Assets (c) 2,306 105 1,063 1,348 — 4,822
Capital expenditures 224 3 1 36 — 264
Retail
Fiscal year 2005 Stores Direct Credit Other Eliminations Total
Net sales (a) $7,197 $439 - $87 — $7,723
Net sales increase 8.5% (1.7%) N/A 62.1% N/A 8.3%
Intersegment revenues — — — — — —
Interest expense, net (b) — — $(17) (28) — (45)
Finance charges and other, net (2) 1 186 11 — 196
Depreciation and amortization 223 3 1 49 — 276
Earnings before income taxes 998 88 53 (254) — 885
Earnings before income taxes
as a percentage of net sales 13.9% 20.2% N/A N/A N/A 11.5%
Goodwill 8 16 - 28 — 52
Acquired tradename — — — 84 — 84
Assets (c) 2,285 85 1,164 1,387 — 4,921
Capital expenditures 232 3 1 36 — 272
(a) Net sales in Other include foreign sales of $62, $104 and $94 for 2007, 2006 and 2005.
(b) Interest income of $14, $13 and $12 for 2007, 2006 and 2005 is recorded in our Other segment as an offset to interest expense, net.
(c) Assets in Other include foreign assets of $0, $212 and $205 at the end of 2007, 2006 and 2005. It also includes unallocated assets in corporate headquarters, consisting primarily of
cash, land, buildings and equipment, and deferred tax assets.