Nordstrom 2007 Annual Report Download - page 63
Download and view the complete annual report
Please find page 63 of the 2007 Nordstrom annual report below. You can navigate through the pages in the report by either clicking on the pages listed below, or by using the keyword search tool below to find specific information within the annual report.-
 1
1 -
2
-
3
-
4
-
5
-
6
-
7
-
8
-
9
-
10
-
11
-
12
-
13
-
14
-
15
-
16
-
17
-
18
-
19
-
20
-
21
-
22
-
23
-
24
-
25
-
26
-
27
-
28
-
29
-
30
-
31
-
32
-
33
-
34
-
35
-
36
-
37
-
38
-
39
-
40
-
41
-
42
-
43
-
44
-
45
-
46
-
47
-
48
-
49
-
50
-
51
-
52
-
 53
53 -
 54
54 -
 55
55 -
 56
56 -
 57
57 -
 58
58 -
 59
59 -
 60
60 -
 61
61 -
 62
62 -
 63
63 -
 64
64 -
 65
65 -
 66
66 -
 67
67 -
 68
68 -
 69
69 -
 70
70 -
 71
71 -
 72
72 -
 73
73 -
74
-
75
-
76
-
77
-
78
-
79
-
80
-
81
-
82
-
83
-
84
 |
 |

Nordstrom, Inc. and subsidiaries 55
Nordstrom, Inc.
Notes to Consolidated Financial Statements
Dollar and share amounts in millions except per share and per option amounts
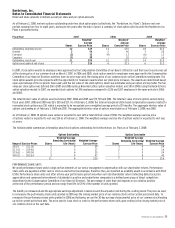
As of February 2, 2008, we have options outstanding under two stock option plans (collectively, the “Nordstrom, Inc. Plans”). Options vest over
periods ranging from four to eight years, and expire ten years after the date of grant. A summary of stock option activity under the Nordstrom, Inc.
Plans is presented below:
Fiscal Year 2007 2006 2005
Shares
Weighted-
Average
Exercise Price
Shares
Weighted-
Average
Exercise Price
Shares
Weighted-
Average
Exercise Price
Outstanding, beginning of year 12 $19 14 $15 18 $13
Granted 2 54 2 40 3 26
Exercised (2) 15 (4) 13 (6) 13
Cancelled (1) 38 — 25 (1) 16
Outstanding, end of year 11 $25 12 $19 14 $15
Options exercisable at end of year 7 $16 6 $13 6 $12
In 2007, stock option awards to employees were approved by the Compensation Committee of our Board of Directors and their exercise price was set
at the closing price of our common stock on March 1, 2007. In 2006 and 2005, stock option awards to employees were approved by the Compensation
Committee of our Board of Directors and their exercise price was set at the closing price of our common stock on the Committee meeting date. The
stock option awards provide recipients with the opportunity for financial rewards when our stock price increases. The awards are determined based
upon a percentage of the recipients’ base salary and the fair value of the stock options, which was estimated using an option pricing model. The fair
value per stock option was $20 and $16 in 2007 and 2006 (using a Binomial Lattice option valuation model), and $10 in 2005 (using the Black-Scholes
option valuation model). In 2007, we awarded stock options to 1,195 employees compared to 1,236 and 1,207 employees in the same periods in 2006
and 2005.
The total intrinsic value of options exercised during 2007, 2006 and 2005 was $79, $111 and $102. The total fair value of stock options vested during
fiscal years 2007, 2006 and 2005 was $24, $30 and $27. As of February 2, 2008, the total unrecognized stock-based compensation expense related to
nonvested stock options was $36, which is expected to be recognized over a weighted average period of 29 months. The aggregate intrinsic value of
options outstanding as of February 2, 2008 was $185. The aggregate intrinsic value of options exercisable as of February 2, 2008, was $160.
As of February 2, 2008, 10 options were vested or expected to vest with a total intrinsic value of $180. The weighted average exercise price
of options vested or expected to vest was $24 as of February 2, 2008. The weighted average exercise life of options vested or expected to vest was
six years.
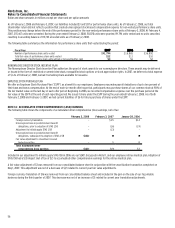
The following table summarizes information about stock options outstanding for the Nordstrom, Inc. Plans as of February 2, 2008:
Options Outstanding Options Exercisable
Range of Exercise Prices
Shares
Weighted-Average
Remaining Contractual
Life (Years)
Weighted-Average
Exercise Price
Shares
Weighted-Average
Remaining Contractual
Life (Years)
Weighted-Average
Exercise Price
$8.03 - $11.00 3 4 $9
3 4 $9
$11.01 - $19.60 3 5 17
2 5 16
$19.61 - $40.00 2 6 25
1 5 24
$40.01 - $53.63 3 9 47
1 8 40
11 6
$25
7 5 $16
PERFORMANCE SHARE UNITS
We grant performance share units to align certain elements of our senior management compensation with our shareholder returns. Performance
share units are payable in either cash or stock as elected by the employee; therefore they are classified as a liability award in accordance with SFAS
123(R). Performance share units vest after a three-year performance period only when our total shareholder return (reflecting daily stock price
appreciation and compound reinvestment of dividends) is positive and outperforms companies in a defined peer group of direct competitors
determined by the Compensation Committee of our Board of Directors. The percentage of units that vest depends on our relative position
at the end of the performance period and can range from 0% to 125% of the number of units granted.
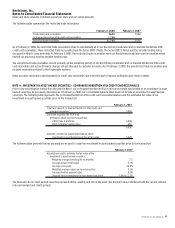
The liability is remeasured and the appropriate earnings adjustment is taken at each fiscal quarter-end during the vesting period. The price we used
to remeasure the performance share units granted in 2005 was the closing market price of our common stock on the current period-end date. To
remeasure the performance share units granted in 2006 and following, we use the 30-day average closing market price of our common stock leading
up to the current period-end date. The price used to issue stock or cash for the performance share units upon vesting is the closing market price of
our common stock on the vest date.