Nordstrom 2007 Annual Report Download - page 25
Download and view the complete annual report
Please find page 25 of the 2007 Nordstrom annual report below. You can navigate through the pages in the report by either clicking on the pages listed below, or by using the keyword search tool below to find specific information within the annual report.-
 1
1 -
2
-
3
-
4
-
5
-
6
-
7
-
8
-
9
-
10
-
11
-
12
-
13
-
14
-
 15
15 -
 16
16 -
 17
17 -
 18
18 -
 19
19 -
 20
20 -
 21
21 -
 22
22 -
 23
23 -
 24
24 -
 25
25 -
 26
26 -
 27
27 -
 28
28 -
 29
29 -
 30
30 -
 31
31 -
 32
32 -
 33
33 -
 34
34 -
 35
35 -
36
-
37
-
38
-
39
-
40
-
41
-
42
-
43
-
44
-
45
-
46
-
47
-
48
-
49
-
50
-
51
-
52
-
53
-
54
-
55
-
56
-
57
-
58
-
59
-
60
-
61
-
62
-
63
-
64
-
65
-
66
-
67
-
68
-
69
-
70
-
71
-
72
-
73
-
74
-
75
-
76
-
77
-
78
-
79
-
80
-
81
-
82
-
83
-
84
 |
 |

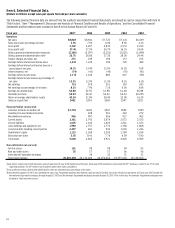
Nordstrom, Inc. and subsidiaries 17
2006 VS 2005 NET SALES
All of our full-line store regions and most of our full-line store merchandise categories had same-store sales increases. Our full-line stores had
a 5.9% same-store sales increase, ahead of 5.4% in 2005. Our compelling merchandise offering, combined with customer service, drove sales increases
throughout our business, particularly in accessories, cosmetics and men’s apparel. The largest increase was in our accessories category, driven by
handbags and sunglasses. Cosmetics benefited from increases in the artistry and prestigious branded lines. Additionally, the men’s increase came
from men’s contemporary, including fashion denim and t-shirts.
Our Rack same-store sales increased 10.9% in 2006, on top of an increase of 14.8% in 2005. The sales growth came from all regions and
merchandise categories.
Our online store sales drove Nordstrom Direct’s 2006 total net sales increase of 23.5%. Our online sales benefited from the overall Internet
marketplace expansion, driven by the continued adoption of higher-speed Internet connections which allow for convenient and efficient shopping,
as well as utilization of the Internet as a tool for research and information before making a purchase decision. Catalog sales experienced an overall
decline because we reduced our catalog mailings beginning in the middle of 2005.
Total net sales increased 10.8% as a result of our same-store sales increases as well as from the five full-line stores and one Rack store opened since
February 2006. We also relocated one full-line store and expanded one Rack store, which contributed to our increase in total net sales.
In the 53rd week, we had sales of $118. Sales for the 53rd week represented 1.5% of the total percentage increase versus 2005.
2008 FORECAST OF SAME-STORE SALES
In 2008, we have opened two full-line stores and plan to open six more full-line stores and three Rack stores. This will increase retail square footage by
approximately 6%. We expect 2008 same-store sales to be approximately flat to a 2% decrease, with the first half of the year lower than the annual
rate and the second half of the year higher than the annual rate.
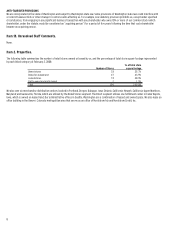
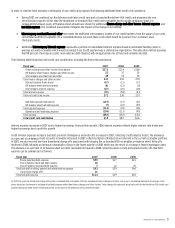
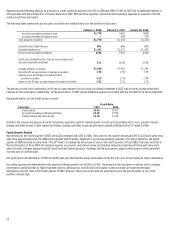
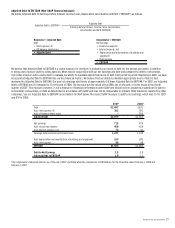
Gross Profit
Fiscal year 2007 2006 2005
Gross profit $3,302 $3,207 $2,835
Gross profit rate 37.4% 37.5% 36.7%
Average inventory per square foot $52.70 $52.37 $51.25
Inventory turnover rate* 5.16 5.06 4.84
* Inventory turnover rate calculated as annual cost of sales divided by 5-quarter average inventory.
2007 VS 2006 GROSS PROFIT
Our gross profit rate is made up of both merchandise margin rate and buying and occupancy cost rate. Compared to last year, our gross profit rate
declined 6 basis points, driven primarily by markdowns at our full-line stores. During the year we experienced increasing inventory levels coupled with
slower sales trends. To realign our inventory levels, we took higher markdowns during the last half of the year. The increase in markdowns was offset
by a decrease in our buying and occupancy costs. The decrease in these expenses related to performance-based incentives and lower expense
resulting from the sale of our Façonnable business.
The increase in our average inventory per square foot supports the growth of our designer business in apparel, accessories and shoes. Although we
encountered softer sales trends during the latter half of 2007, inventory discipline and growth in sales throughout the year resulted in improvement
in our inventory turnover rate, which increased 1.9%.
2006 VS 2005 GROSS PROFIT
Our gross profit rate improved 75 basis points, driven primarily by expansion of our merchandise margin rate. All major merchandise categories
contributed to this rate expansion. Our women’s apparel category experienced significant rate expansion in the second half of the year due to strategy
changes that brought a sharper focus to our merchandise offering, resulting in more regular price selling and fewer markdowns.
For the first time, in 2006 our buying and occupancy costs included expenses related to stock options awarded primarily to our merchant and product
development groups. These costs were $12 and impacted our gross profit rate by 14 basis points. Despite this additional expense, our buying and
occupancy cost rate also improved, driven by sales growth relative to our mostly fixed buying and occupancy costs.
Sales growth and continued inventory discipline resulted in improvement in our inventory turnover rate, which increased 4.5%.
2008 FORECAST OF GROSS PROFIT
In 2008, we expect a net 30 to 60 basis point decrease in our gross profit rate as we will have additional occupancy costs from the eight full-line stores and
three Rack stores we will open in 2008.