Nordstrom 2007 Annual Report Download - page 62
Download and view the complete annual report
Please find page 62 of the 2007 Nordstrom annual report below. You can navigate through the pages in the report by either clicking on the pages listed below, or by using the keyword search tool below to find specific information within the annual report.-
 1
1 -
2
-
3
-
4
-
5
-
6
-
7
-
8
-
9
-
10
-
11
-
12
-
13
-
14
-
15
-
16
-
17
-
18
-
19
-
20
-
21
-
22
-
23
-
24
-
25
-
26
-
27
-
28
-
29
-
30
-
31
-
32
-
33
-
34
-
35
-
36
-
37
-
38
-
39
-
40
-
41
-
42
-
43
-
44
-
45
-
46
-
47
-
48
-
49
-
50
-
51
-
 52
52 -
 53
53 -
 54
54 -
 55
55 -
 56
56 -
 57
57 -
 58
58 -
 59
59 -
 60
60 -
 61
61 -
 62
62 -
 63
63 -
 64
64 -
 65
65 -
 66
66 -
 67
67 -
 68
68 -
 69
69 -
 70
70 -
 71
71 -
 72
72 -
73
-
74
-
75
-
76
-
77
-
78
-
79
-
80
-
81
-
82
-
83
-
84
 |
 |

54
Nordstrom, Inc.
Notes to Consolidated Financial Statements
Dollar and share amounts in millions except per share and per option amounts
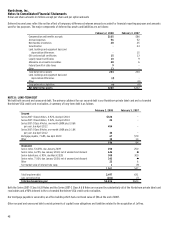
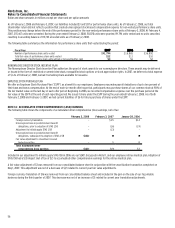
The following table illustrates the effect on net earnings and earnings per share if we had applied the fair value recognition provisions of SFAS 123
in 2005:
Fiscal year 2005
Net earnings, as reported $551
Add: stock-based compensation expense included
in reported net earnings, net of tax 8
Deduct: stock-based compensation expense
determined under fair value, net of tax (25)
Pro forma net earnings $534
Earnings per share:
Basic-as reported $2.03
Diluted-as reported $1.98
Basic-pro forma $1.96
Diluted-pro forma $1.92
Prior to the adoption of SFAS 123(R), we classified all tax benefits resulting from the exercise of stock options and ESPP as operating cash inflows.
SFAS 123(R) requires the benefits of tax deductions in excess of the compensation cost recognized for those awards to be classified as financing cash
inflows rather than operating cash inflows, on a prospective basis. This amount is shown as “Excess tax benefit from stock-based payments” in the
consolidated statement of cash flows and was $26 and $38 in 2007 and 2006.
STOCK OPTIONS
In 2005, we used the Black-Scholes option valuation model to estimate the fair value of the stock options under SFAS 123. When we adopted SFAS 123(R),
we elected to use the Binomial Lattice option valuation model. We believe that this model provides a better estimate of fair value than the Black-Scholes
option valuation model, as it can accommodate variability in assumptions for expected volatility, dividends and risk-free interest rates.
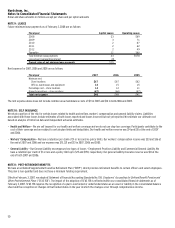
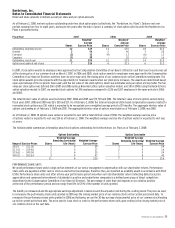
We used the following assumptions to estimate the fair value for stock options at grant date:
Fiscal year 2007 2006 2005
Risk-free interest rate 4.6% - 4.7% 4.9% - 5.1% 3.9%
Volatility 35.0% 37.0% 44.3%
Dividend yield 1.0% 1.0% 1.7%
Expected life in years 5.7 5.4 5.0
The weighted average fair value per option at the grant date was $20, $16 and $10 in 2007, 2006 and 2005. The following describes the significant
assumptions used to estimate the fair value of options granted:
xRisk-free interest rate: For 2007 and 2006, the rate represents the yield on U.S. Treasury zero-coupon securities that mature over the 10-year
life of the stock options. For 2005, the rate was the yield on the U.S. Treasury zero-coupon securities which matured near the end of the
expected life of the stock options.
xExpected volatility: For 2007 and 2006, the expected volatility is based on a combination of the historical volatility of our common stock and
the implied volatility of exchange traded options for our common stock. For 2005, the expected volatility was estimated using the historical
volatility of our common stock.
xExpected dividend yield: For 2007 and 2006, the yield is our forecasted dividend yield for the next ten years. In 2005, the expected dividend
yield was based on our historical dividend yield.
xExpected life in years: The expected life represents the estimated period of time until option exercise. For 2007 and 2006, the expected term of
options granted was derived from the output of the Binomial Lattice option valuation model and was based on our historical exercise behavior
taking into consideration the contractual term of the option and our employees’ expected exercise and post-vesting employment termination
behavior. For 2005, the expected life was determined based on our historical exercise behavior.