Nordstrom 2007 Annual Report Download - page 38
Download and view the complete annual report
Please find page 38 of the 2007 Nordstrom annual report below. You can navigate through the pages in the report by either clicking on the pages listed below, or by using the keyword search tool below to find specific information within the annual report.-
 1
1 -
2
-
3
-
4
-
5
-
6
-
7
-
8
-
9
-
10
-
11
-
12
-
13
-
14
-
15
-
16
-
17
-
18
-
19
-
20
-
21
-
22
-
23
-
24
-
25
-
26
-
27
-
 28
28 -
 29
29 -
 30
30 -
 31
31 -
 32
32 -
 33
33 -
 34
34 -
 35
35 -
 36
36 -
 37
37 -
 38
38 -
 39
39 -
 40
40 -
 41
41 -
 42
42 -
 43
43 -
 44
44 -
 45
45 -
 46
46 -
 47
47 -
 48
48 -
49
-
50
-
51
-
52
-
53
-
54
-
55
-
56
-
57
-
58
-
59
-
60
-
61
-
62
-
63
-
64
-
65
-
66
-
67
-
68
-
69
-
70
-
71
-
72
-
73
-
74
-
75
-
76
-
77
-
78
-
79
-
80
-
81
-
82
-
83
-
84
 |
 |
30
Dividends
In 2007, we paid dividends of $0.54 per share, the eleventh consecutive year that our annual dividends increased. We paid dividends of $0.42 and $0.32 in
2006 and 2005. In determining the amount of dividends to pay, we analyze our dividend payout ratio and dividend yield, and balance the dividend payment
with our operating performance and capital resources. We target a dividend payout ratio of approximately 20% to 25% of net income, an increase from our
prior target of 18% to 20%. For the dividend yield, which is calculated as our dividends per share divided by our stock price, we target a 1.3% long-term
yield. While we plan to increase dividends over time, we will balance future increases with our operating performance and available capital resources.
In February 2008, we declared a quarterly dividend of $0.16 per share, increased from $0.135 per share in the prior year.
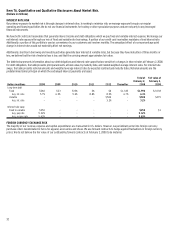
Liquidity
We maintain a level of liquidity sufficient to allow us to cover our seasonal cash needs and to minimize our need for short-term borrowings. We believe
that our operating cash flows, existing cash and available credit facilities are sufficient to finance our cash requirements for the next 12 months.
Over the long term, we manage our cash and capital structure to maximize shareholder return, strengthen our financial position and maintain flexibility
for future strategic initiatives. We continuously assess our debt and leverage levels, capital expenditure requirements, principal debt payments,
dividend payouts, potential share repurchases and future investments or acquisitions. We believe our operating cash flows, existing
cash and available credit facilities, as well as any potential future borrowing facilities, will be sufficient to fund these scheduled future payments
and potential long-term initiatives.
CRITICAL ACCOUNTING POLICIES
The preparation of our financial statements requires that we make estimates and judgments that affect the reported amounts of assets, liabilities,
revenues and expenses, and disclosure of contingent assets and liabilities. We base our estimates on historical experience and on other assumptions that
we believe to be reasonable under the circumstances. Actual results may differ from these estimates. The following discussion highlights the policies
we feel are critical and should be read in conjunction with the Notes to the Consolidated Financial Statements.
Inventory
Our merchandise inventories are primarily stated at the lower of cost or market using the retail inventory method. Under the retail method,
the valuation of inventories and the resulting gross margins are determined by applying a calculated cost-to-retail ratio to the retail value of
ending inventory. To determine if the retail value of our inventory should be marked down, we consider current and anticipated demand, customer
preferences, age of the merchandise and fashion trends. As our inventory retail value is adjusted regularly to reflect market conditions, our inventory
is valued at the lower of cost or market. Inherent in the retail inventory method are certain significant management judgments that may significantly
affect the ending inventory valuation as well as gross margin. Among others, the significant estimates used in inventory valuation are obsolescence
and shrinkage.
We reserve for obsolescence based on historical trends and specific identification. Shrinkage is estimated as a percentage of net sales for the
period from the most recent semi-annual inventory count based on historical shrinkage results. Therefore, our obsolescence reserve and shrinkage
percentage contain uncertainties as the calculations require management to make assumptions and to apply judgment regarding a number of factors,
including market conditions, the selling environment, historical results and current inventory trends.
Management does not believe that the assumptions used in these estimates will change significantly based on prior experience. In prior years, we have
made no material changes to our estimates included in the calculations of the obsolescence and shrinkage reserves. A 10% change in the obsolescence
reserve would have impacted net income by approximately $2 for the year ended February 2, 2008. We do not believe a 10% change in our shrink
percentage would have a material effect on our net earnings.
Revenue Recognition
We recognize revenues net of estimated returns and we exclude sales taxes. Our retail stores record revenue at the point of sale. Our catalog and
online sales include shipping revenue and are recorded upon estimated delivery to the customer. As part of the normal sales cycle, we receive
customer merchandise returns. To recognize the financial impact of sales returns, we estimate the amount of goods that will be returned and reduce
sales and cost of sales accordingly. Inherent in establishing and maintaining a sales return reserve are management judgments around customer
return patterns and return rates. We utilize historical return patterns to estimate our expected returns and, in prior years, we have made no material
changes to our estimates included in the sales return reserve.
Although we believe we have sufficient current and historical knowledge to record reasonable estimates of sales returns, there is a possibility that
actual returns could differ from recorded amounts. A 10% change in the sales return reserve would have had a $3 impact on our net earnings for the
year ended February 2, 2008.