Nordstrom 2007 Annual Report Download - page 27
Download and view the complete annual report
Please find page 27 of the 2007 Nordstrom annual report below. You can navigate through the pages in the report by either clicking on the pages listed below, or by using the keyword search tool below to find specific information within the annual report.-
 1
1 -
2
-
3
-
4
-
5
-
6
-
7
-
8
-
9
-
10
-
11
-
12
-
13
-
14
-
15
-
16
-
 17
17 -
 18
18 -
 19
19 -
 20
20 -
 21
21 -
 22
22 -
 23
23 -
 24
24 -
 25
25 -
 26
26 -
 27
27 -
 28
28 -
 29
29 -
 30
30 -
 31
31 -
 32
32 -
 33
33 -
 34
34 -
 35
35 -
 36
36 -
 37
37 -
38
-
39
-
40
-
41
-
42
-
43
-
44
-
45
-
46
-
47
-
48
-
49
-
50
-
51
-
52
-
53
-
54
-
55
-
56
-
57
-
58
-
59
-
60
-
61
-
62
-
63
-
64
-
65
-
66
-
67
-
68
-
69
-
70
-
71
-
72
-
73
-
74
-
75
-
76
-
77
-
78
-
79
-
80
-
81
-
82
-
83
-
84
 |
 |

Nordstrom, Inc. and subsidiaries 19
Gain on Sale of Façonnable
During the third quarter of 2007, we completed the sale of the Façonnable business in exchange for cash of $216, net of transaction costs, and realized
a gain on sale of $34. The impact to reported earnings per diluted share for the year was $0.09, net of tax of $13.
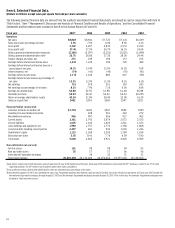
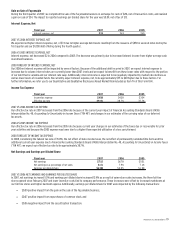
Interest Expense, Net
Fiscal year 2007 2006 2005
Interest expense, net $74 $43 $45
2007 VS 2006 INTEREST EXPENSE, NET
We experienced higher interest expense, net, of $74 due to higher average debt levels resulting from the issuance of $850 in secured notes during the
first quarter and our $1,000 debt offering during the fourth quarter.
2006 VS 2005 INTEREST EXPENSE, NET
Interest expense, net decreased $2 in 2006 compared to 2005. The decrease was primarily due to increased interest income from higher average cash
investment balances.
2008 FORECAST OF INTEREST EXPENSE, NET
Our 2008 net interest expense will be impacted by several factors. Because of the additional debt incurred in 2007, we expect interest expense to
increase due to volume. Interest rates are currently lower than 2007 levels and we expect to benefit from these lower rates with respect to the portion
of our debt that is variable and our interest rate swap. Additionally, interest income is expected to be negatively impacted by market rate declines as
well as lower levels of invested funds. We currently expect interest expense, net, to be approximately $55 to $60 higher due to these factors. For
further information, we refer you to our Quantitative and Qualitative Disclosures About Market Risk included as Item 7A of this Form 10-K.
Income Tax Expense
Fiscal year 2007 2006 2005
Income tax expense $458 $428 $334
Effective tax rate 39.0% 38.7% 37.7%
2007 VS 2006 INCOME TAX EXPENSE
Our effective tax rate in 2007 increased from the 2006 rate because of the current year impact of Financial Accounting Standards Board (FASB)
Interpretation No. 48,
Accounting for Uncertainty in Income Taxes
(“FIN 48”) and changes in our estimates of the carrying value of our deferred
tax assets.
2006 VS 2005 INCOME TAX EXPENSE
Our effective tax rate in 2006 increased from the 2005 rate because current year changes in our estimates of the taxes due or recoverable for prior
year activities and because the 2005 expense was lower due to a higher than expected utilization of a loss carryforward.
2008 FORECAST OF INCOME TAX EXPENSE
In 2008, considering the federal tax rate of 35.0%, the net effect of state income taxes, the net effect of permanently nondeductible items and the
additional current year expense due to Financial Accounting Standards Board (FASB) Interpretation No. 48,
Accounting for Uncertainty in Income Taxes
(“FIN 48”), we expect our effective tax rate to be approximately 38.7%.
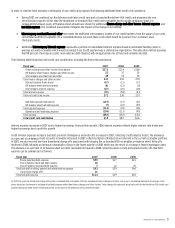
Net Earnings and Earnings per Diluted Share
Fiscal year 2007 2006 2005
Net earnings $715 $678 $551
Net earnings as a percentage of net sales 8.1% 7.9% 7.1%
Earnings per diluted share $2.88 $2.55 $1.98
2007 VS 2006 NET EARNINGS AND EARNINGS PER DILUTED SHARE
In 2007, net earnings increased 5.5% and earnings per diluted share increased 12.9% as a result of same-store sales increases, the three full-line
stores opened since February 2007 and lower incentive costs tied to company performance. These increases were offset by increased markdowns at
our full-line stores and higher bad debt expense. Additionally, earnings per diluted share for 2007 were impacted by the following transactions:
x$0.09 positive impact from the gain on the sale of the Façonnable business,
x$0.07 positive impact from repurchases of common stock, and
x$0.06 negative impact from the securitization transaction.