Nordstrom 2007 Annual Report Download - page 30
Download and view the complete annual report
Please find page 30 of the 2007 Nordstrom annual report below. You can navigate through the pages in the report by either clicking on the pages listed below, or by using the keyword search tool below to find specific information within the annual report.-
 1
1 -
2
-
3
-
4
-
5
-
6
-
7
-
8
-
9
-
10
-
11
-
12
-
13
-
14
-
15
-
16
-
17
-
18
-
19
-
 20
20 -
 21
21 -
 22
22 -
 23
23 -
 24
24 -
 25
25 -
 26
26 -
 27
27 -
 28
28 -
 29
29 -
 30
30 -
 31
31 -
 32
32 -
 33
33 -
 34
34 -
 35
35 -
 36
36 -
 37
37 -
 38
38 -
 39
39 -
 40
40 -
41
-
42
-
43
-
44
-
45
-
46
-
47
-
48
-
49
-
50
-
51
-
52
-
53
-
54
-
55
-
56
-
57
-
58
-
59
-
60
-
61
-
62
-
63
-
64
-
65
-
66
-
67
-
68
-
69
-
70
-
71
-
72
-
73
-
74
-
75
-
76
-
77
-
78
-
79
-
80
-
81
-
82
-
83
-
84
 |
 |

22
Operational and marketing expense as a percent of credit volume increased from 2.3% in 2006 and 2005 to 2.4% in 2007 due to additional expense of
$13 associated with the introduction of Fashion Rewards in 2007. Without these expenses, operational and marketing expenses as a percent of Credit
volume would have decreased.
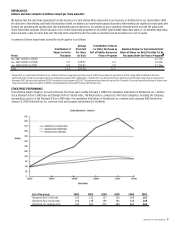
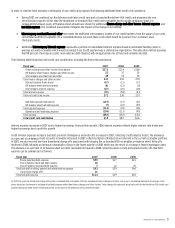
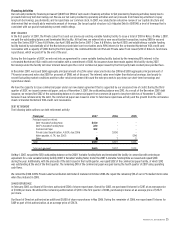
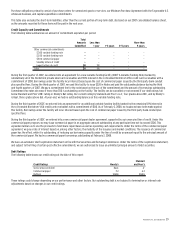
The following table summarizes our accounts receivable and related metrics for the last three fiscal years:
February 2, 2008 February 3, 2007 January 28, 2006
Accounts receivable on-balance sheet $1,778 $626 $585
Accounts receivable off-balance sheet - 908 739
Total accounts receivable $1,778 $1,534 $1,324
Assumed ratio of debt financed 80% 80% 80%
Estimated funding level $1,422 $1,227 $1,059
Net accounts receivable investment $356 $307 $265
Credit card contribution, net of tax, as a percentage of net
accounts receivable investment 3.2% 16.8% 15.6%
Average accounts receivable $1,660 $1,416 $1,264
Net write-offs as a percentage of average receivables 3.5% 2.5% 3.5%
Allowance as a percentage of on-balance sheet
accounts receivable 4.1% 2.7% 2.9%
Balances over 30 days as a percentage of accounts receivable 2.5% 2.1% 1.7%
The decline in credit card contribution, net of tax, as a percentage of net accounts receivable investment in 2007 was driven by increased bad debt
expense, as discussed above. Additionally, as discussed above, in 2007 we had additional expense associated with the introduction of Fashion Rewards.
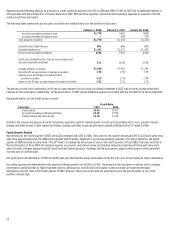
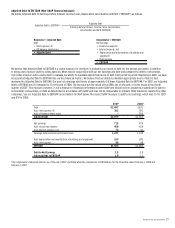
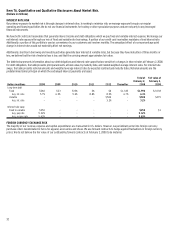
Key growth metrics for the Credit division include:
Growth Rates
Fiscal year 2007 2006
Credit volume 14.6% 18.0%
Accounts receivable (combined portfolios) 15.9% 15.9%
Finance charges and other income 16.0% 17.6%
Growth in the volume and amount of credit transactions typically results in related growth in credit card receivables and, in turn, growth in finance
charges and other income. Credit volume and finance charges and other income growth were favorably affected by the 53rd week in 2006.
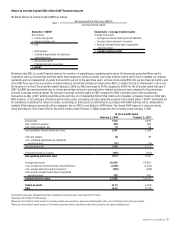
Fourth Quarter Results
Net earnings for the fourth quarter of 2007 were $212 compared with $232 in 2006. Total sales for the quarter decreased 4.4% to $2,514 and same-store
sales were approximately flat. The 2006 fiscal calendar had 53 weeks compared to our normal operating calendar of 52 weeks; therefore, the fourth
quarter of 2006 included an extra week (“the 53rd week”). Excluding the extra week of sales in the fourth quarter of fiscal 2006, total sales were flat in
the fourth quarter of fiscal 2007. Our designer apparel, accessories, and women’s shoe merchandise categories experienced the largest same-store
sales increases. Designer apparel features luxury and high-fashion products. Handbags led the accessories category while women’s shoes benefited
from the sale of comfort boots.
Our gross profit rate declined to 37.6% from 38.3% last year. Merchandise margin decreased versus the prior year, driven mainly by higher markdowns.
Our selling, general and administrative rate improved 68 basis points from 26.0% to 25.4%. The primary driver was lower incentives tied to company
performance, partially offset by higher bad debt expense. Although our overall credit card quality is above average, we experienced higher
delinquency and loss rates in the fourth quarter of 2007. However, these were in line with our expectations and, the overall quality of our credit
portfolio remains high.