Nordstrom 2007 Annual Report Download - page 32
Download and view the complete annual report
Please find page 32 of the 2007 Nordstrom annual report below. You can navigate through the pages in the report by either clicking on the pages listed below, or by using the keyword search tool below to find specific information within the annual report.-
 1
1 -
2
-
3
-
4
-
5
-
6
-
7
-
8
-
9
-
10
-
11
-
12
-
13
-
14
-
15
-
16
-
17
-
18
-
19
-
20
-
21
-
 22
22 -
 23
23 -
 24
24 -
 25
25 -
 26
26 -
 27
27 -
 28
28 -
 29
29 -
 30
30 -
 31
31 -
 32
32 -
 33
33 -
 34
34 -
 35
35 -
 36
36 -
 37
37 -
 38
38 -
 39
39 -
 40
40 -
 41
41 -
 42
42 -
43
-
44
-
45
-
46
-
47
-
48
-
49
-
50
-
51
-
52
-
53
-
54
-
55
-
56
-
57
-
58
-
59
-
60
-
61
-
62
-
63
-
64
-
65
-
66
-
67
-
68
-
69
-
70
-
71
-
72
-
73
-
74
-
75
-
76
-
77
-
78
-
79
-
80
-
81
-
82
-
83
-
84
 |
 |
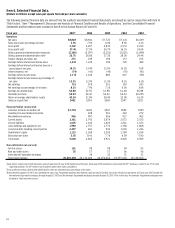
24
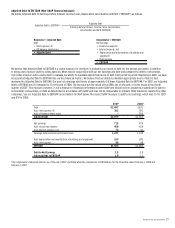
LIQUIDITY AND CAPITAL RESOURCES
Overall, cash decreased by $45 to $358 as of February 2, 2008. The decrease was driven by returns to our shareholders through dividends and repurchases
of our common stock, principal payments on long-term borrowings, and capital expenditures. These decreases were partially offset by proceeds from the
issuance of debt, cash provided by operating activities, and proceeds received from the sale of Façonnable.
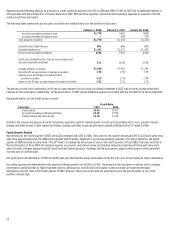
Operating Activities
2007 VS 2006 OPERATING ACTIVITIES
Net cash flow from operating activities decreased from $1,142 to $161, a decrease of $981 primarily driven by our conversion of our co-branded Nordstrom
VISA credit card receivables into an on-balance sheet securitization program in the first quarter of 2007. As a result of the transaction, we recorded the co-
branded Nordstrom VISA credit card receivables on our consolidated balance sheet and eliminated our investment in asset backed securities resulting in a
decline of operating cash flow of $881.
2006 VS 2005 OPERATING ACTIVITIES
Net cash flow from operating activities increased from $776 to $1,142, an increase of $366 primarily because we reduced our investment in asset backed
securities by $350 to fund the repayment of $300 of private label securitization debt. Also, we were successful in expanding our private label card and co-
branded Nordstrom VISA credit card programs, which increased our investment in these programs but provided increased earnings.
2008 FORECAST FOR OPERATING ACTIVITIES
In 2008, we expect cash flow from operating activities to improve in part due to the non-reoccurrence of the 2007 securitization transaction. In 2007,
we moved the co-branded Nordstrom VISA credit card receivables onto our balance sheet as part of the securitization transaction which reduced our
2007 cash flow from operating activities.
Investing Activities
Net cash flow used in investing activities increased $52 from $218 in 2006 to $270 in 2007. In 2007, we sold our Façonnable business in exchange for cash
of $216, net of transaction costs. These proceeds were offset by investing cash outflows for capital expenditures totaling $501.
In 2005 and 2006, we had two principal types of investing activities: capital expenditures and short-term investments. In 2006, we sold our short-term
investments and primarily used the proceeds for common stock repurchases.
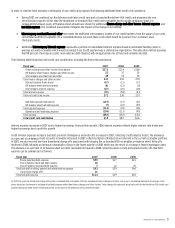
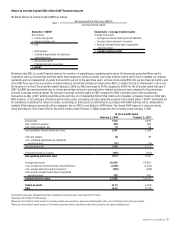
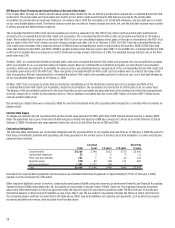
CAPITAL EXPENDITURES
Our annual capital expenditures ranged from $264 to $501 between 2005 and 2007. The largest components of these expenditures were for new or
relocated stores and store remodels.
In 2007 we opened three full-line stores at Natick Collection in Natick, Massachusetts; Twelve Oaks Mall in Novi, Michigan; and Cherry Creek Shopping
Center in Denver, Colorado. We also opened one Rack store at Southcenter Square in Tukwila, Washington. Together these openings increased our gross
square footage approximately 2.6%. Our total square footage as of February 2, 2008 was 21. In 2007, 51% of our capital expenditures were for new or
relocated stores, 24% were for major remodels and 3% were for minor remodels. In addition, 8% of our capital expenditures were for information
technology and 14% were for other projects.
Our capital expenditures over the last three years totaled $1,037. With these capital expenditures, we added stores, enhanced existing facilities and
improved our information systems. More than 1.1 square feet of retail store space have been added during this period, representing an increase of 5.9%
since January 29, 2005.
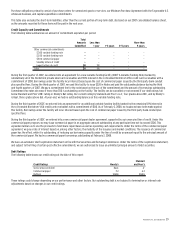
We expect that our capital expenditures will be approximately $3,000 over the next five years, with $536 planned for 2008. We plan to use 55% of this
investment to build new and relocated stores, 27% on remodels, 8% on information technology and 10% for minor remodels and other projects.
Compared to the previous five years, capital expenditures will more than double, with increased spending allocated to new stores. Our current five-year
plans outline a 29% increase in square footage, with 32 announced new stores announced through 2012; over half of these stores will be in our
Northeast, South and Midwest regions. We believe we have the capacity to address additional capital investments should opportunities arise.
In the second half of 2008, we expect to open four new full-line stores and three Rack stores, and in the first half of 2009, we expect to open three new
full-line stores and two Rack stores. We typically incur the majority of our pre-opening costs in the six months prior to opening. In 2008, incremental
new store pre-opening costs, which will be recorded in selling, general and administrative expenses, are expected to impact our earnings per diluted
share by $0.03.
As of February 2, 2008, we were contractually committed to spend $157 for constructing new stores, remodeling existing stores, and other
capital projects.