Nordstrom 2007 Annual Report Download - page 29
Download and view the complete annual report
Please find page 29 of the 2007 Nordstrom annual report below. You can navigate through the pages in the report by either clicking on the pages listed below, or by using the keyword search tool below to find specific information within the annual report.-
 1
1 -
2
-
3
-
4
-
5
-
6
-
7
-
8
-
9
-
10
-
11
-
12
-
13
-
14
-
15
-
16
-
17
-
18
-
 19
19 -
 20
20 -
 21
21 -
 22
22 -
 23
23 -
 24
24 -
 25
25 -
 26
26 -
 27
27 -
 28
28 -
 29
29 -
 30
30 -
 31
31 -
 32
32 -
 33
33 -
 34
34 -
 35
35 -
 36
36 -
 37
37 -
 38
38 -
 39
39 -
40
-
41
-
42
-
43
-
44
-
45
-
46
-
47
-
48
-
49
-
50
-
51
-
52
-
53
-
54
-
55
-
56
-
57
-
58
-
59
-
60
-
61
-
62
-
63
-
64
-
65
-
66
-
67
-
68
-
69
-
70
-
71
-
72
-
73
-
74
-
75
-
76
-
77
-
78
-
79
-
80
-
81
-
82
-
83
-
84
 |
 |

Nordstrom, Inc. and subsidiaries 21
In order to view the total economic contribution of our credit card program, the following additional items need to be considered:
x During 2007, we combined our Nordstrom private label credit card and co-branded Nordstrom VISA credit card programs into one
securitization program. At this time the Nordstrom co-branded VISA credit card receivables were brought on-balance sheet. For
comparability between years, off-balance sheet amounts are shown for additional finance charge and other income, interest expense, and
bad debt expense. This combined presentation mitigates the impact of the change in accounting.
x Intercompany merchant fees and other represents the additional intercompany income of our credit business from the usage of our cards
in the Retail and Direct segments. On a consolidated basis, we avoid these costs which would be incurred if our customers used
third-party cards.
x Additional intercompany interest expense represents a portion of consolidated interest expense based on estimated funding costs for
average accounts receivable which would be needed if our Credit segment was a stand-alone organization. This allocation method assumes
that 80 percent of average accounts receivable are debt-financed with an appropriate mix of fixed and variable rate debt.
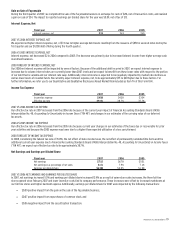
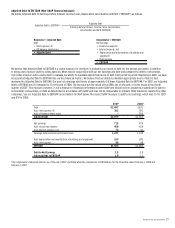
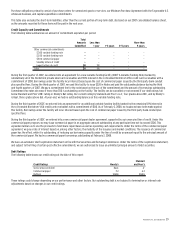
The following table illustrates total credit card contribution, including the items discussed above:
Fiscal year 2007 2006 2005
Finance charges and other income (from above) $271
$214 $186
Off-balance sheet finance charges and other income 22 37 26
Intercompany merchant fees and other 48 43 38
Total finance charges and other income 341 294 250
Interest expense (from above) (37) (11) (17)
Off-balance sheet interest expense (6) (21) (8)
Intercompany interest expense (27) (26) (18)
Total interest expense (70) (58) (43)
Total net credit card income 271 236 207
Bad debt expense (from above) (107) (17) (21)
Off-balance sheet bad debt expense (7) (22) (25)
Total bad debt expense (114) (39) (46)
Operational and marketing expense (138) (113) (95)
Total expense (252) (152) (141)
Total credit card contribution $19 $84 $66
Interest expense increased in 2007 due to higher borrowings from portfolio growth. 2006 interest expense reflects higher interest rate trends and
higher borrowings due to portfolio growth.
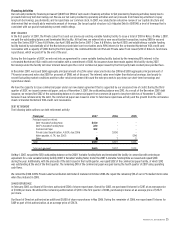
Credit division expenses include a bad debt provision. Delinquency and write-offs increased in 2007, reflecting credit industry trends. The allowance
as a percent of on-balance sheet accounts receivable increased in 2007, reflecting higher estimated losses inherent in the current receivable portfolio.
In 2007, we also incurred one-time transitional charge-offs associated with bringing the co-branded VISA receivables on-balance sheet. Write-offs
declined in 2006 following an increase in bankruptcy filings in the fourth quarter of 2005 which was the result of a change in federal bankruptcy laws.
The allowance as a percent of on-balance sheet accounts receivable decreased in 2006, reflecting lower current and expected write-offs. Bad debt
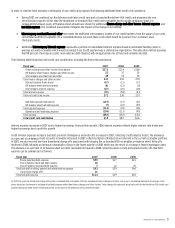
expense can be summarized as follows:
Fiscal year 2007 2006 2005
Private label bad debt expense $40 $17 $21
Visa on-balance sheet bad debt expense 46 — —
Visa off-balance sheet bad debt expense 7 22 25
Total bad debt in selling, general and administrative expense $93 $39 $46
Transitional charge-offs1 21 — —
Total bad debt expense $114 $39 $46
1In 2007, the one-time transitional charge-offs on the co-branded VISA receivables of $21 are included in finance charges and other, net on our consolidated statement of earnings. In the
above disclosure this amount is included in bad debt expense rather than finance charges and other income. These charge-offs represent actual write-offs on the Nordstrom VISA credit card
portfolio during the eight-month transitional period, as discussed in Securitization of Accounts Receivable.