Nordstrom 2007 Annual Report Download - page 31
Download and view the complete annual report
Please find page 31 of the 2007 Nordstrom annual report below. You can navigate through the pages in the report by either clicking on the pages listed below, or by using the keyword search tool below to find specific information within the annual report.-
 1
1 -
2
-
3
-
4
-
5
-
6
-
7
-
8
-
9
-
10
-
11
-
12
-
13
-
14
-
15
-
16
-
17
-
18
-
19
-
20
-
 21
21 -
 22
22 -
 23
23 -
 24
24 -
 25
25 -
 26
26 -
 27
27 -
 28
28 -
 29
29 -
 30
30 -
 31
31 -
 32
32 -
 33
33 -
 34
34 -
 35
35 -
 36
36 -
 37
37 -
 38
38 -
 39
39 -
 40
40 -
 41
41 -
42
-
43
-
44
-
45
-
46
-
47
-
48
-
49
-
50
-
51
-
52
-
53
-
54
-
55
-
56
-
57
-
58
-
59
-
60
-
61
-
62
-
63
-
64
-
65
-
66
-
67
-
68
-
69
-
70
-
71
-
72
-
73
-
74
-
75
-
76
-
77
-
78
-
79
-
80
-
81
-
82
-
83
-
84
 |
 |

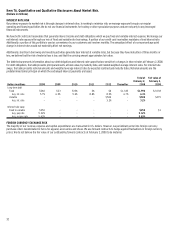
Nordstrom, Inc. and subsidiaries 23
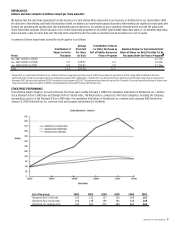
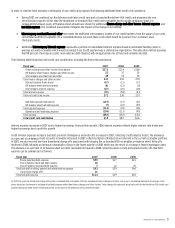
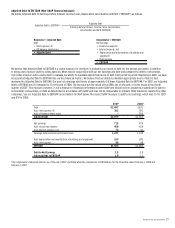
Return on Invested Capital (ROIC) (Non-GAAP financial measure)
We define Return on Invested Capital (ROIC) as follows:
We believe that ROIC is a useful financial measure for investors in evaluating our operating performance for the periods presented. When read in
conjunction with our net earnings and total assets and compared to return on assets, it provides investors with a useful tool to evaluate our ongoing
operations and our management of assets from period to period. In the past three years, we have incorporated ROIC into our key financial metrics, and
since 2005 have used it as an executive incentive measure. Overall performance as measured by ROIC correlates directly to shareholders’ return over
the long term. For the 12 fiscal months ended February 2, 2008, our ROIC decreased to 19.4% compared to 20.9% for the 12 months ended February 3,
2007. Our ROIC decreased primarily due to a lower percentage increase in earnings before interest and income taxes compared to the percentage
increase in average invested capital. The increase in average invested capital in 2007 compared to 2006 is primarily due to the securitization
transaction on May 1, 2007, which brought the entire portfolio of co-branded Nordstrom VISA credit card receivables on-balance sheet as of that date.
ROIC, however, is not a measure of financial performance under accounting principles generally accepted in the United States (“GAAP”) and should not
be considered a substitute for return on assets, net earnings or total assets as determined in accordance with GAAP and may not be comparable to
similarly titled measures reported by other companies. See our ROIC reconciliation to GAAP below. The closest GAAP measure is return on assets,
which decreased to 13.1% from 14.0% for the last 12 months ended February 2, 2008 compared to the 12 months ended February 3, 2007.
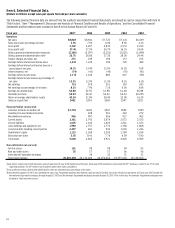
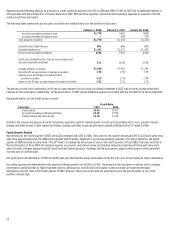
1Depreciation based upon estimated asset base of capitalized operating leases as described in Note 4 below.
2Based upon the trailing 12-month average.
3Based upon the trailing 12-month average for accounts payable, accrued salaries, wages and related benefits, other current liabilities and income taxes payable.
4Based upon the trailing 12-month average of the monthly asset base which is calculated as the trailing 12 months rent expense multiplied by 8.
Net Operating Profit After Taxes (NOPAT)
ROIC = Average Invested Capital
Numerator = NOPAT Denominator = Average Invested Capital
Net earnings Average total assets
+ Income tax expense - Average non-interest-bearing current liabilities
+ Interest expense, net - Average deferred property incentives
= EBIT + Average estimated asset base of capitalized
operating leases
+ Rent expense = Average invested capital
- Estimated depreciation on capitalized
operating leases
= Net operating profit
- Estimated income tax expense
= NOPAT
12 fiscal months ended
February 2, 2008 February 3, 2007
Net earnings $715 $678
Add: income tax expense 458 428
Add: interest expense, net 74 43
Earnings before interest and income taxes 1,247 1,149
Add: rent expense 48 48
Less: estimated depreciation on capitalized
operating leases1(26) (26)
Net operating profit 1,269 1,171
Estimated income tax expense (497) (453)
Net operating profit after taxes $772 $718
Average total assets2 $5,455 $4,854
Less: average non-interest-bearing current liabilities3(1,506) (1,424)
Less: average deferred property incentives2(359) (358)
Add: average estimated asset base of capitalized
operating leases4395 362
Average invested capital $3,985 $3,434
Return on assets 13.1% 14.0%
ROIC 19.4% 20.9%