Nordstrom 2007 Annual Report Download - page 21
Download and view the complete annual report
Please find page 21 of the 2007 Nordstrom annual report below. You can navigate through the pages in the report by either clicking on the pages listed below, or by using the keyword search tool below to find specific information within the annual report.-
 1
1 -
2
-
3
-
4
-
5
-
6
-
7
-
8
-
9
-
10
-
 11
11 -
 12
12 -
 13
13 -
 14
14 -
 15
15 -
 16
16 -
 17
17 -
 18
18 -
 19
19 -
 20
20 -
 21
21 -
 22
22 -
 23
23 -
 24
24 -
 25
25 -
 26
26 -
 27
27 -
 28
28 -
 29
29 -
 30
30 -
 31
31 -
32
-
33
-
34
-
35
-
36
-
37
-
38
-
39
-
40
-
41
-
42
-
43
-
44
-
45
-
46
-
47
-
48
-
49
-
50
-
51
-
52
-
53
-
54
-
55
-
56
-
57
-
58
-
59
-
60
-
61
-
62
-
63
-
64
-
65
-
66
-
67
-
68
-
69
-
70
-
71
-
72
-
73
-
74
-
75
-
76
-
77
-
78
-
79
-
80
-
81
-
82
-
83
-
84
 |
 |
Nordstrom, Inc. and subsidiaries 13
REPURCHASES
(Dollars and share amounts in millions except per share amounts)
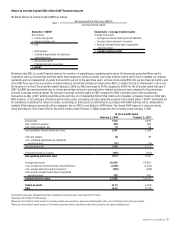
We believe that the cash flows generated from the business are best utilized when reinvested in our business or distributed to our shareholders. With
the objective of minimizing cash held on the balance sheet, we balance our shareholder payout objectives with meeting our capital structure goals and
funding our operating and capital plans. Our shareholder payout objective is to continue to pay a quarterly dividend and to execute the authorized
share repurchase program. In the execution of our share repurchase programs we use either open market repurchase plans or accelerated repurchase
plans and seek a rate of return that over the long term exceeds the after-tax yield on invested cash and exceeds our cost of capital.
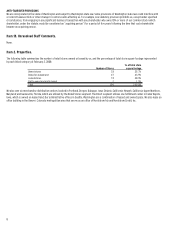
A summary of share repurchases during the fourth quarter is as follows:
Period
Total Number of
Shares (or Units)
Purchased
Average
Price Paid
Per Share
(or Unit)
Total Number of Shares
(or Units) Purchased as
Part of Publicly Announced
Plans or Programs
Maximum Number (or Approximate Dollar
Value) of Shares (or Units) that May Yet Be
Purchased Under the Plans or Programs1
Nov. 2007 (11/4/07 to 12/1/07) - - - $1,751
Dec. 2007 (12/2/07 to 1/5/08) 5.4 $35.97 5.4 $1,556
Jan. 2008 (1/6/08 to 2/2/08) 5.9 $32.91 5.9 $1,364
Total 11.3 $34.38 11.3
1 During 2007, we repurchased 39 shares of our common stock for an aggregate purchase price of $1,728 (an average price per share of $44.17). In May 2006, the Board of Directors
authorized $1,000 of share repurchases which was exhausted in August 2007. Additionally, in August 2007, our Board of Directors authorized a $1,500 share repurchase program and in
November 2007 authorized an additional $1,000, bringing the total program to $2,500. The program authorization will expire after 24 months. The actual amount and timing of future share
repurchases will be subject to market conditions and applicable Securities and Exchange Commission rules.
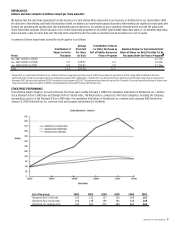
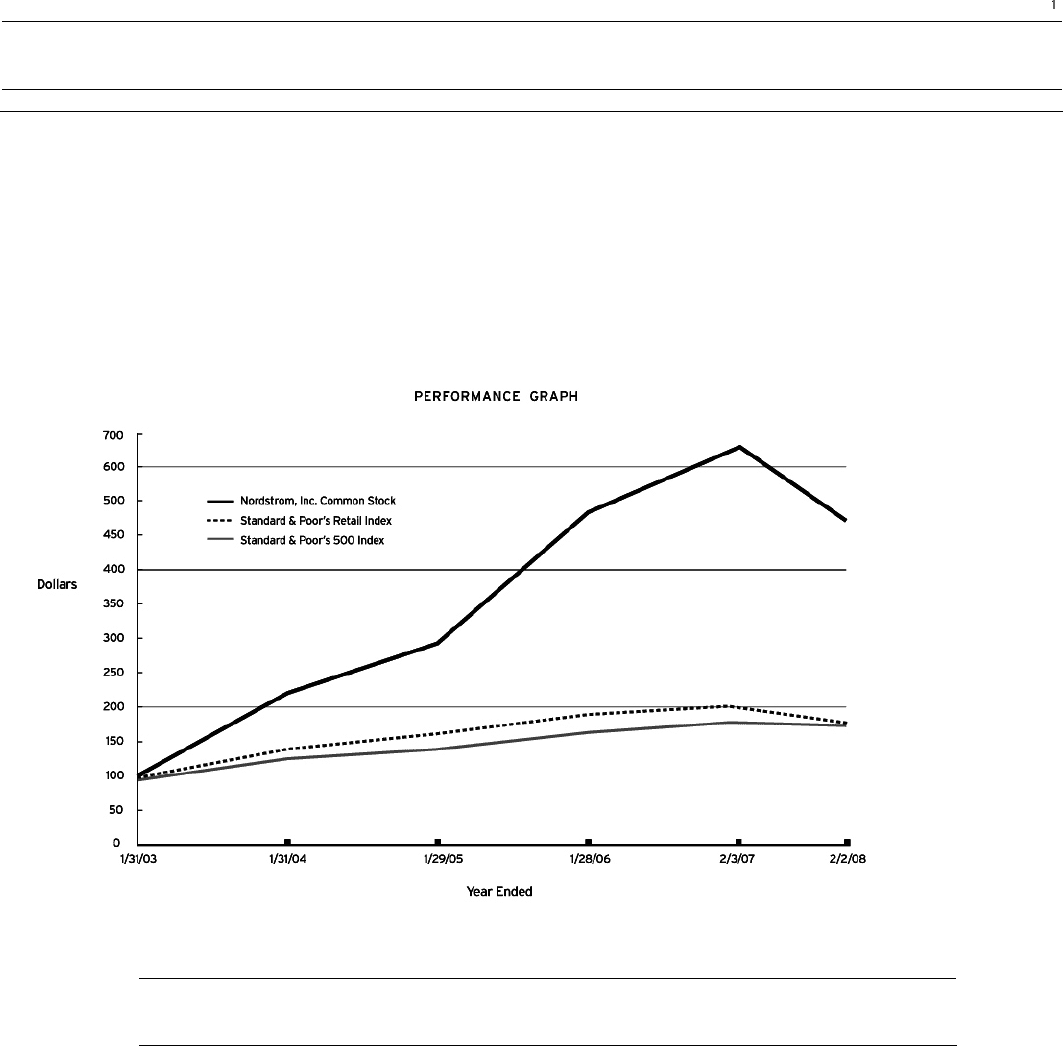
STOCK PRICE PERFORMANCE
The following graph compares, for each of the last five fiscal years, ending February 2, 2008, the cumulative total return of Nordstrom, Inc. common
stock, Standard & Poor’s 500 Index and Standard & Poor’s Retail Index. The Retail Index is comprised of 40 retail companies, including the Company,
representing a sector of the Standard & Poor’s 500 Index. The cumulative total return of Nordstrom, Inc. common stock assumes $100 invested on
January 31, 2003 in Nordstrom, Inc. common stock and assumes reinvestment of dividends.
End of fiscal year: 2002 2003 2004 2005 2006 2007
Standard & Poor’s 500 Index 100 132 137 150 169 163
Standard & Poor’s Retail Index 100 148 169 182 208 168
Nordstrom, Inc. common stock 100 222 272 488 660 469