Nordstrom 2007 Annual Report Download - page 44
Download and view the complete annual report
Please find page 44 of the 2007 Nordstrom annual report below. You can navigate through the pages in the report by either clicking on the pages listed below, or by using the keyword search tool below to find specific information within the annual report.-
 1
1 -
2
-
3
-
4
-
5
-
6
-
7
-
8
-
9
-
10
-
11
-
12
-
13
-
14
-
15
-
16
-
17
-
18
-
19
-
20
-
21
-
22
-
23
-
24
-
25
-
26
-
27
-
28
-
29
-
30
-
31
-
32
-
33
-
 34
34 -
 35
35 -
 36
36 -
 37
37 -
 38
38 -
 39
39 -
 40
40 -
 41
41 -
 42
42 -
 43
43 -
 44
44 -
 45
45 -
 46
46 -
 47
47 -
 48
48 -
 49
49 -
 50
50 -
 51
51 -
 52
52 -
 53
53 -
 54
54 -
55
-
56
-
57
-
58
-
59
-
60
-
61
-
62
-
63
-
64
-
65
-
66
-
67
-
68
-
69
-
70
-
71
-
72
-
73
-
74
-
75
-
76
-
77
-
78
-
79
-
80
-
81
-
82
-
83
-
84
 |
 |

36
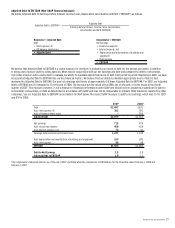
Nordstrom, Inc.
Consolidated Statements of Earnings
In millions except per share amounts and percentages
Fiscal year 2007 2006 2005
Net sales $8,828 $8,561 $7,723
Cost of sales and related buying and occupancy costs (5,526) (5,354) (4,888)
Gross profit 3,302 3,207 2,835
Selling, general and administrative expenses (2,360) (2,297) (2,101)
Finance charges and other, net 271 239 196
Gain on sale of Façonnable 34 — —
Earnings before interest and income taxes 1,247 1,149 930
Interest expense, net (74) (43) (45)
Earnings before income taxes 1,173 1,106 885
Income tax expense (458) (428) (334)
Net earnings $715 $678 $551
Earnings per basic share $2.92 $2.60 $2.03
Earnings per diluted share $2.88 $2.55 $1.98
Basic shares 245 261 272
Diluted shares 249 266 278
Cash dividends paid per share $0.54 $0.42 $0.32
Consolidated Statements of Earnings (% of Net sales)
Fiscal year 2007 2006 2005
Net sales 100.0% 100.0% 100.0%
Cost of sales and related buying and occupancy costs (62.6) (62.5) (63.3)
Gross profit 37.4 37.5 36.7
Selling, general and administrative expenses (26.7) (26.8) (27.2)
Finance charges and other, net 3.1 2.8 2.5
Gain on sale of Façonnable 0.4 — —
Earnings before interest and income taxes 14.1 13.4 12.0
Interest expense, net (0.8) (0.5) (0.6)
Earnings before income taxes 13.3 12.9 11.5
Income tax expense (as a % of earnings before
income taxes) (39.0) (38.7) (37.7)
Net earnings 8.1% 7.9% 7.1%
The accompanying Notes to Consolidated Financial Statements are an integral part of these financial statements.